BITF Daily Technical Analysis
Bitfarms Ltd
Bitcoin mining, High-Performance Computing (HPC) and Artificial Intelligence (AI) infrastructure
BITF Technical Analysis Summary
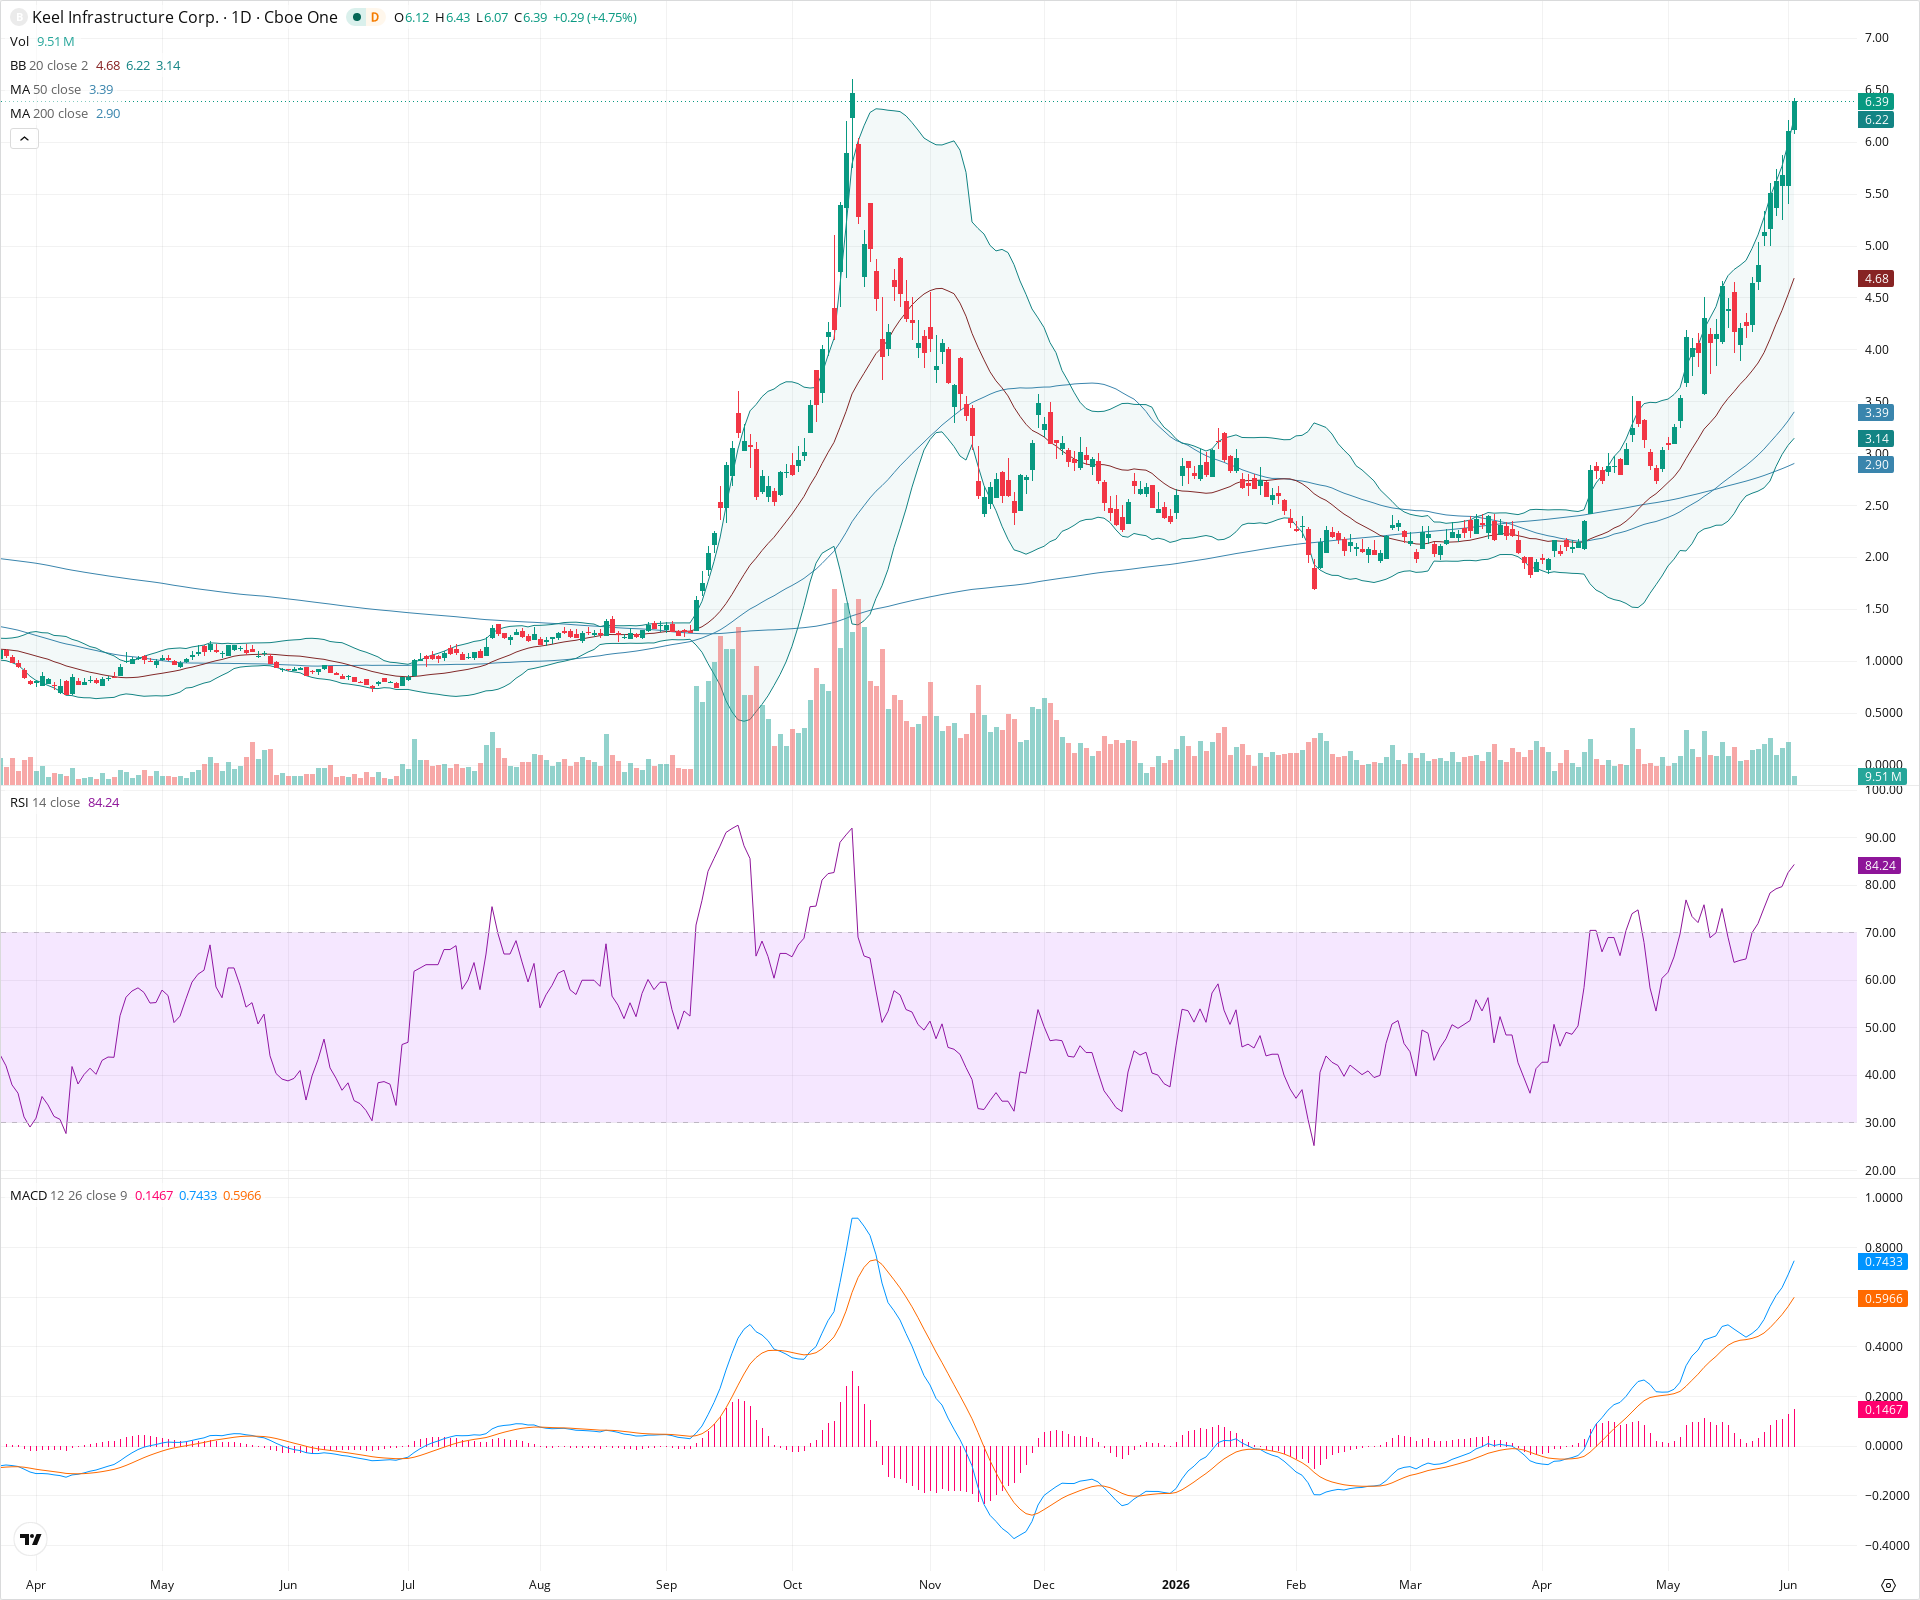
BITF is in the midst of a powerful, parabolic uptrend following a breakout from a long-term basing period. The broader structural picture is robustly bullish, confirmed by highly favorable moving average alignments and strong MACD momentum. Nevertheless, the velocity of the recent move has pushed the RSI into extreme overbought territory as the price retests a major historical resistance zone, suggesting a high probability of near-term volatility, consolidation, or a sharp pullback to digest the gains.
Included In Lists
Related Tickers of Interest
BITF Daily Chart
Sentiment
Short-term Sentiment (days to weeks): Bullish
The short-term trend is powerfully upward, characterized by steep, consecutive bullish candles riding the upper boundary of rapidly expanding Bollinger Bands. MACD momentum is strongly positive and expanding. However, an extremely elevated RSI near 84 signals deep overbought conditions, raising the risk of imminent consolidation.
Long-term Sentiment (weeks to months): Bullish
The longer-term structure has definitively shifted positive following a prolonged consolidation phase. The price is trending well above key moving averages, with the 50-day SMA sloping upward and positioned significantly above a rising 200-day SMA, indicating a sustained structural uptrend.
Report Metadata
- Timeframe: daily
- Generated at: 2026-06-02T14:16:59.064Z
- Model: gemini-3.1-pro-preview
Support Price Levels
| Level | Range | Strength | Notes |
|---|---|---|---|
| $4.75 | $4.50 - $5.00 | Strong | A visible zone of prior consolidation and swing lows formed just before the most recent steep, parabolic leg upward. |
| $3.50 | $3.30 - $3.70 | Strong | A deeper structural support zone encompassing prior breakout highs and the current location of the rising 50-day SMA. |
Resistance Price Levels
| Level | Range | Strength | Notes |
|---|---|---|---|
| $6.50 | $6.40 - $6.60 | Strong | Immediate resistance defined by the current upper Bollinger Band and a major historical supply zone established by the massive price spike seen earlier in the chart. |
Potential Chart Patterns in Formation
| Strength | Pattern | Signal | Target | Details |
|---|---|---|---|---|
| Strong | Parabolic Advance | Bullish | N/A | Price action has entered a steep, nearly vertical ascent, consistently trading at or outside the upper Bollinger Band alongside severely overbought RSI readings, indicative of climax buying. |
| Strong | Long-Term Base Breakout | Bullish | N/A | The stock has clearly exited a multi-month period of choppy consolidation at lower levels, establishing a new regime of higher highs and higher lows confirmed by moving average alignment. |
Frequently Asked Questions about BITF
What is the current sentiment for BITF?
The short-term sentiment for BITF is currently Bullish because The short-term trend is powerfully upward, characterized by steep, consecutive bullish candles riding the upper boundary of rapidly expanding Bollinger Bands. MACD momentum is strongly positive and expanding. However, an extremely elevated RSI near 84 signals deep overbought conditions, raising the risk of imminent consolidation.. The long-term trend is classified as Bullish.
What are the key support levels for BITF?
StockDips.AI has identified key support levels for BITF at $4.75 and $3.50. These levels may represent potential accumulation zones where buying interest could emerge.
Is BITF in a significant dip or a Value Dip right now?
BITF has a Value Score of 23/100. It is not currently flagged as a significant dip in the Top Dips list. It is not listed as a Value Dip because the long-term sentiment or value-score threshold does not qualify.
View the full interactive analysis on StockDips.AI.