CAVA Monthly Technical Analysis
Cava Group Inc
Fast-casual restaurant chain offering Mediterranean bowls, pitas, and salads.
CAVA Technical Analysis Summary
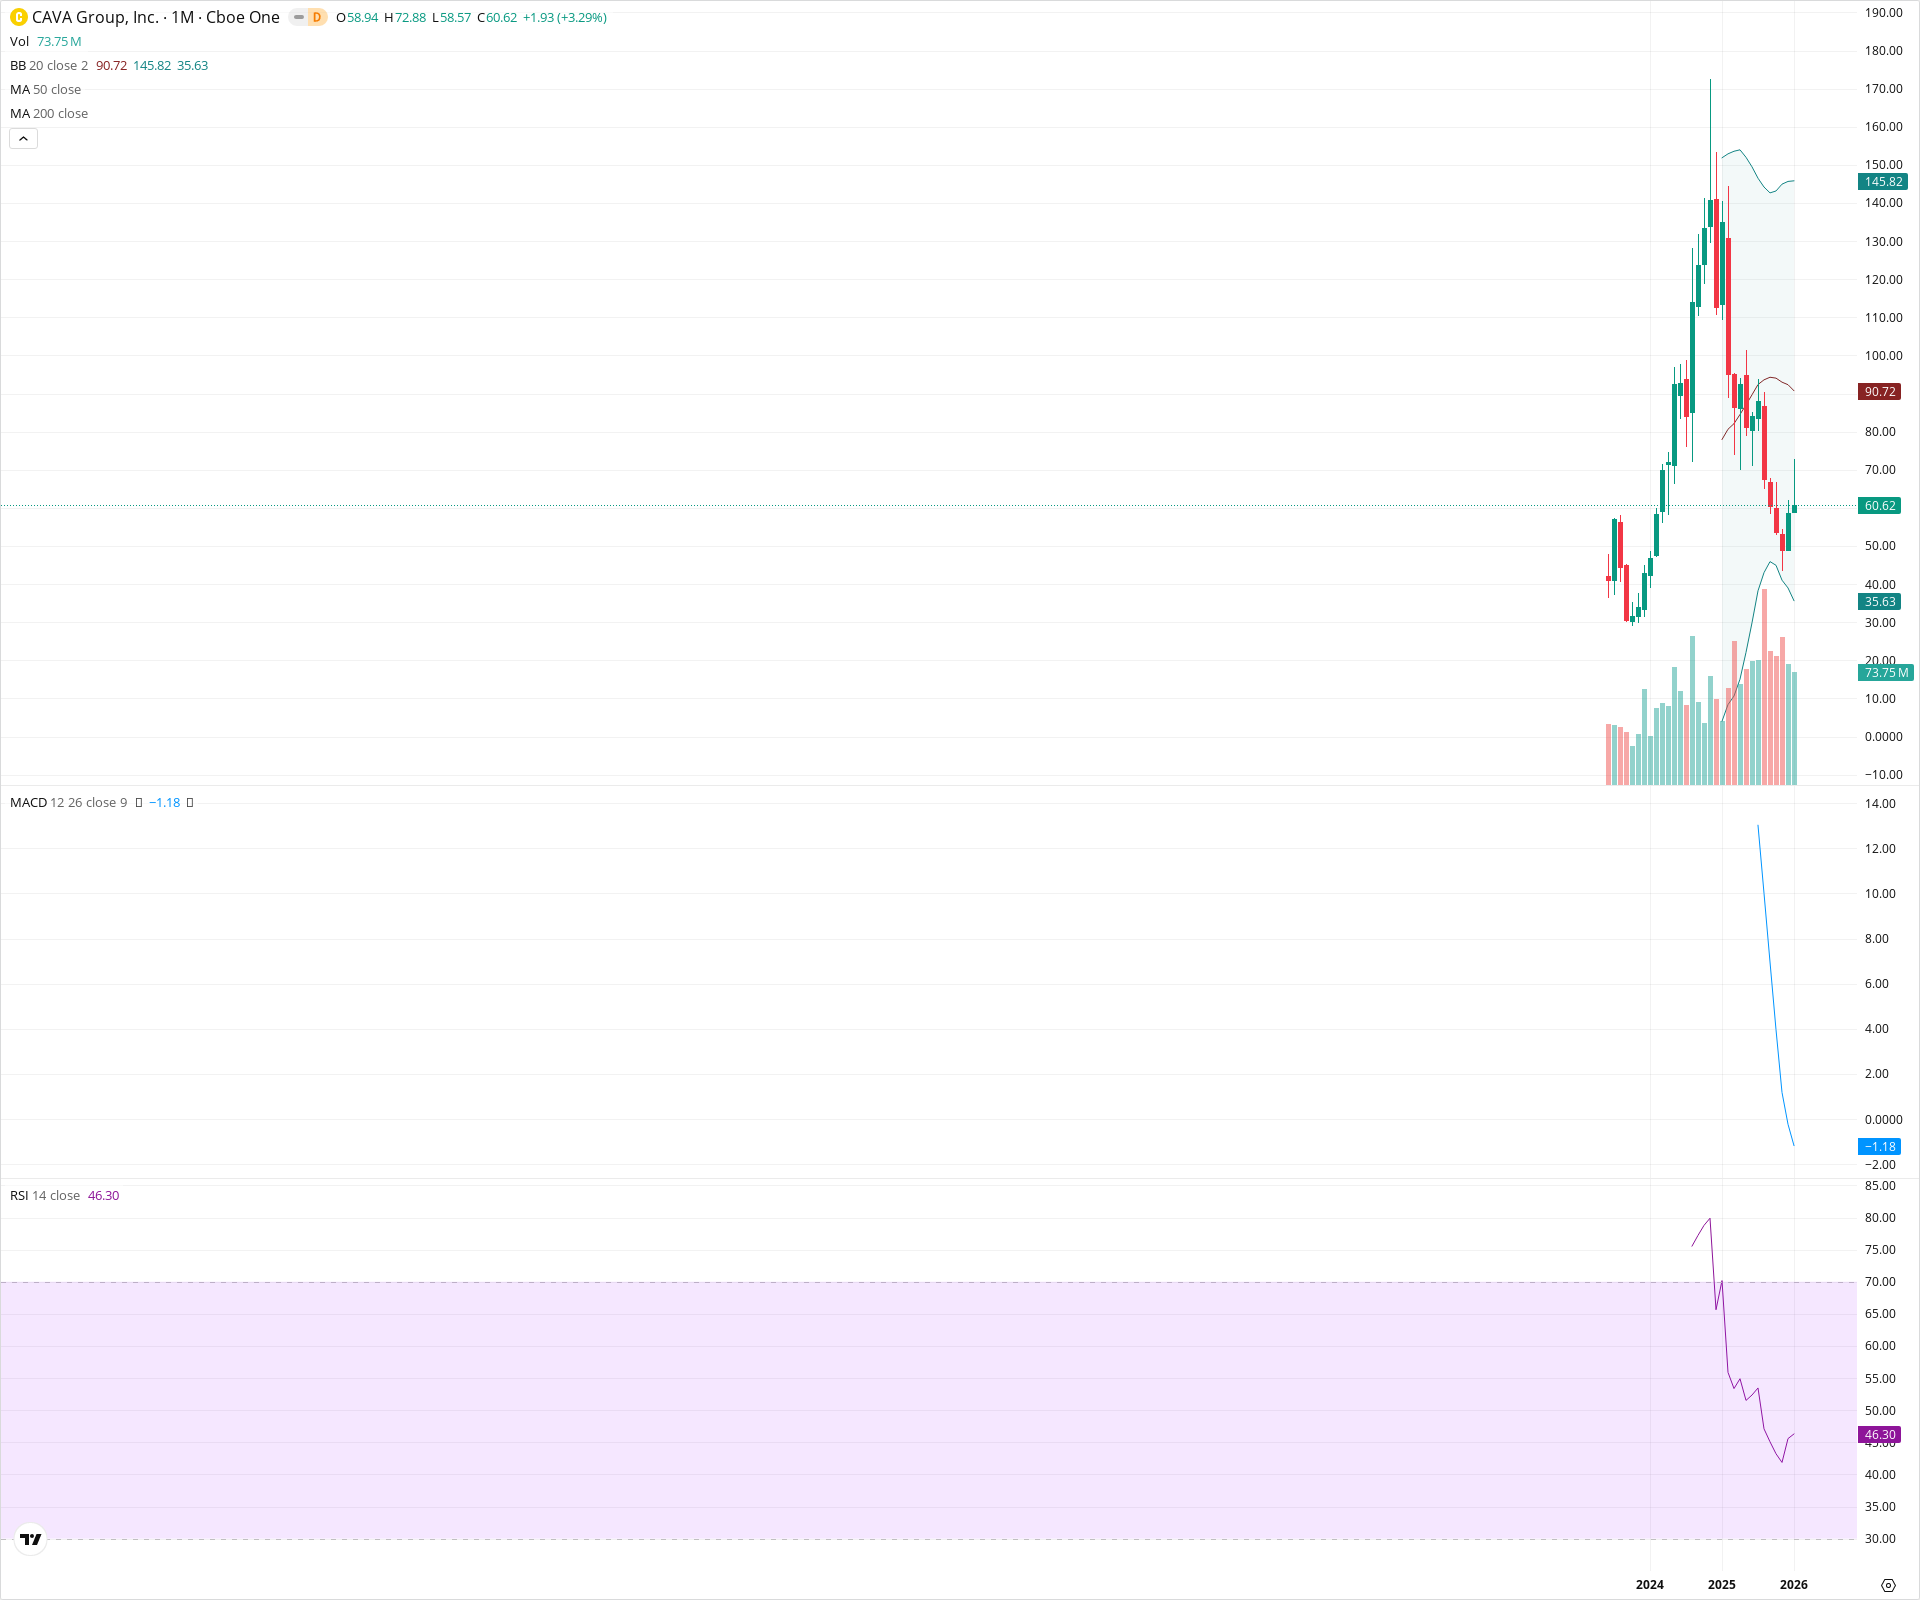
CAVA exhibits a classic 'boom and bust' cycle on the monthly chart, having retraced significantly from a parabolic peak near 172 down to the 60 level. The structural damage is severe with price falling below the key 20-month SMA and the MACD showing extreme negative momentum. The stock is currently attempting to stabilize near its initial breakout zone, but long-term investors face a neutral-to-bearish outlook until a sustained base can be constructed. The risk of mean reversion to the lower Bollinger Band around 35 remains if current support fails.
Included In Lists
Related Tickers of Interest
CAVA Monthly Chart
Sentiment
Short-term Sentiment (days to weeks): Bearish
Despite a minor bounce in the current month, the stock has suffered a catastrophic drop from highs of ~170 to ~60. The 20-month SMA has been lost, and momentum indicators like the MACD are plunging vertically, indicating selling pressure remains dominant.
Long-term Sentiment (weeks to months): Neutral
The secular uptrend has been broken by a 'blow-off top' pattern, returning price to early breakout levels. While the long-term structure is damaged, the price is approaching historical accumulation zones where a new secular base could eventually form.
Report Metadata
- Timeframe: monthly
- Generated at: 2026-02-02T05:30:30.359Z
- Model: gemini-3-pro-preview
Support Price Levels
| Level | Range | Strength | Notes |
|---|---|---|---|
| $59.00 | $58.00 - $60.00 | Weak | Immediate support at the current month's low; tentative stabilization area. |
| $37.50 | $35.00 - $40.00 | Strong | Major historical base and location of the Lower Bollinger Band (35.63). |
Resistance Price Levels
| Level | Range | Strength | Notes |
|---|---|---|---|
| $90.50 | $90.00 - $91.00 | Strong | The 20-month SMA (90.72) serves as the primary overhead trend resistance. |
| $147.50 | $145.00 - $150.00 | Weak | Previous distribution zone and proximity to Upper Bollinger Band. |
Potential Chart Patterns in Formation
| Strength | Pattern | Signal | Target | Details |
|---|---|---|---|---|
| Strong | Blow-off Top | Bearish | $40.00 | A parabolic vertical price rise to ~172 followed by an immediate and sharp crash, erasing over 60% of value in a few months. |
Frequently Asked Questions about CAVA
What is the current sentiment for CAVA?
The short-term sentiment for CAVA is currently Bearish because Despite a minor bounce in the current month, the stock has suffered a catastrophic drop from highs of ~170 to ~60. The 20-month SMA has been lost, and momentum indicators like the MACD are plunging vertically, indicating selling pressure remains dominant.. The long-term trend is classified as Neutral.
What are the key support levels for CAVA?
StockDips.AI has identified key support levels for CAVA at $59.00 and $37.50. These levels may represent potential accumulation zones where buying interest could emerge.
Is CAVA in a significant dip or a Value Dip right now?
CAVA has a Value Score of 60/100. It is not currently flagged as a significant dip in the Top Dips list. It is not listed as a Value Dip because the long-term sentiment or value-score threshold does not qualify.
View the full interactive analysis on StockDips.AI.