CMG Daily Technical Analysis
Chipotle Mexican Grill
Fast-casual restaurant chain serving customizable Mexican-inspired meals.
CMG Technical Analysis Summary
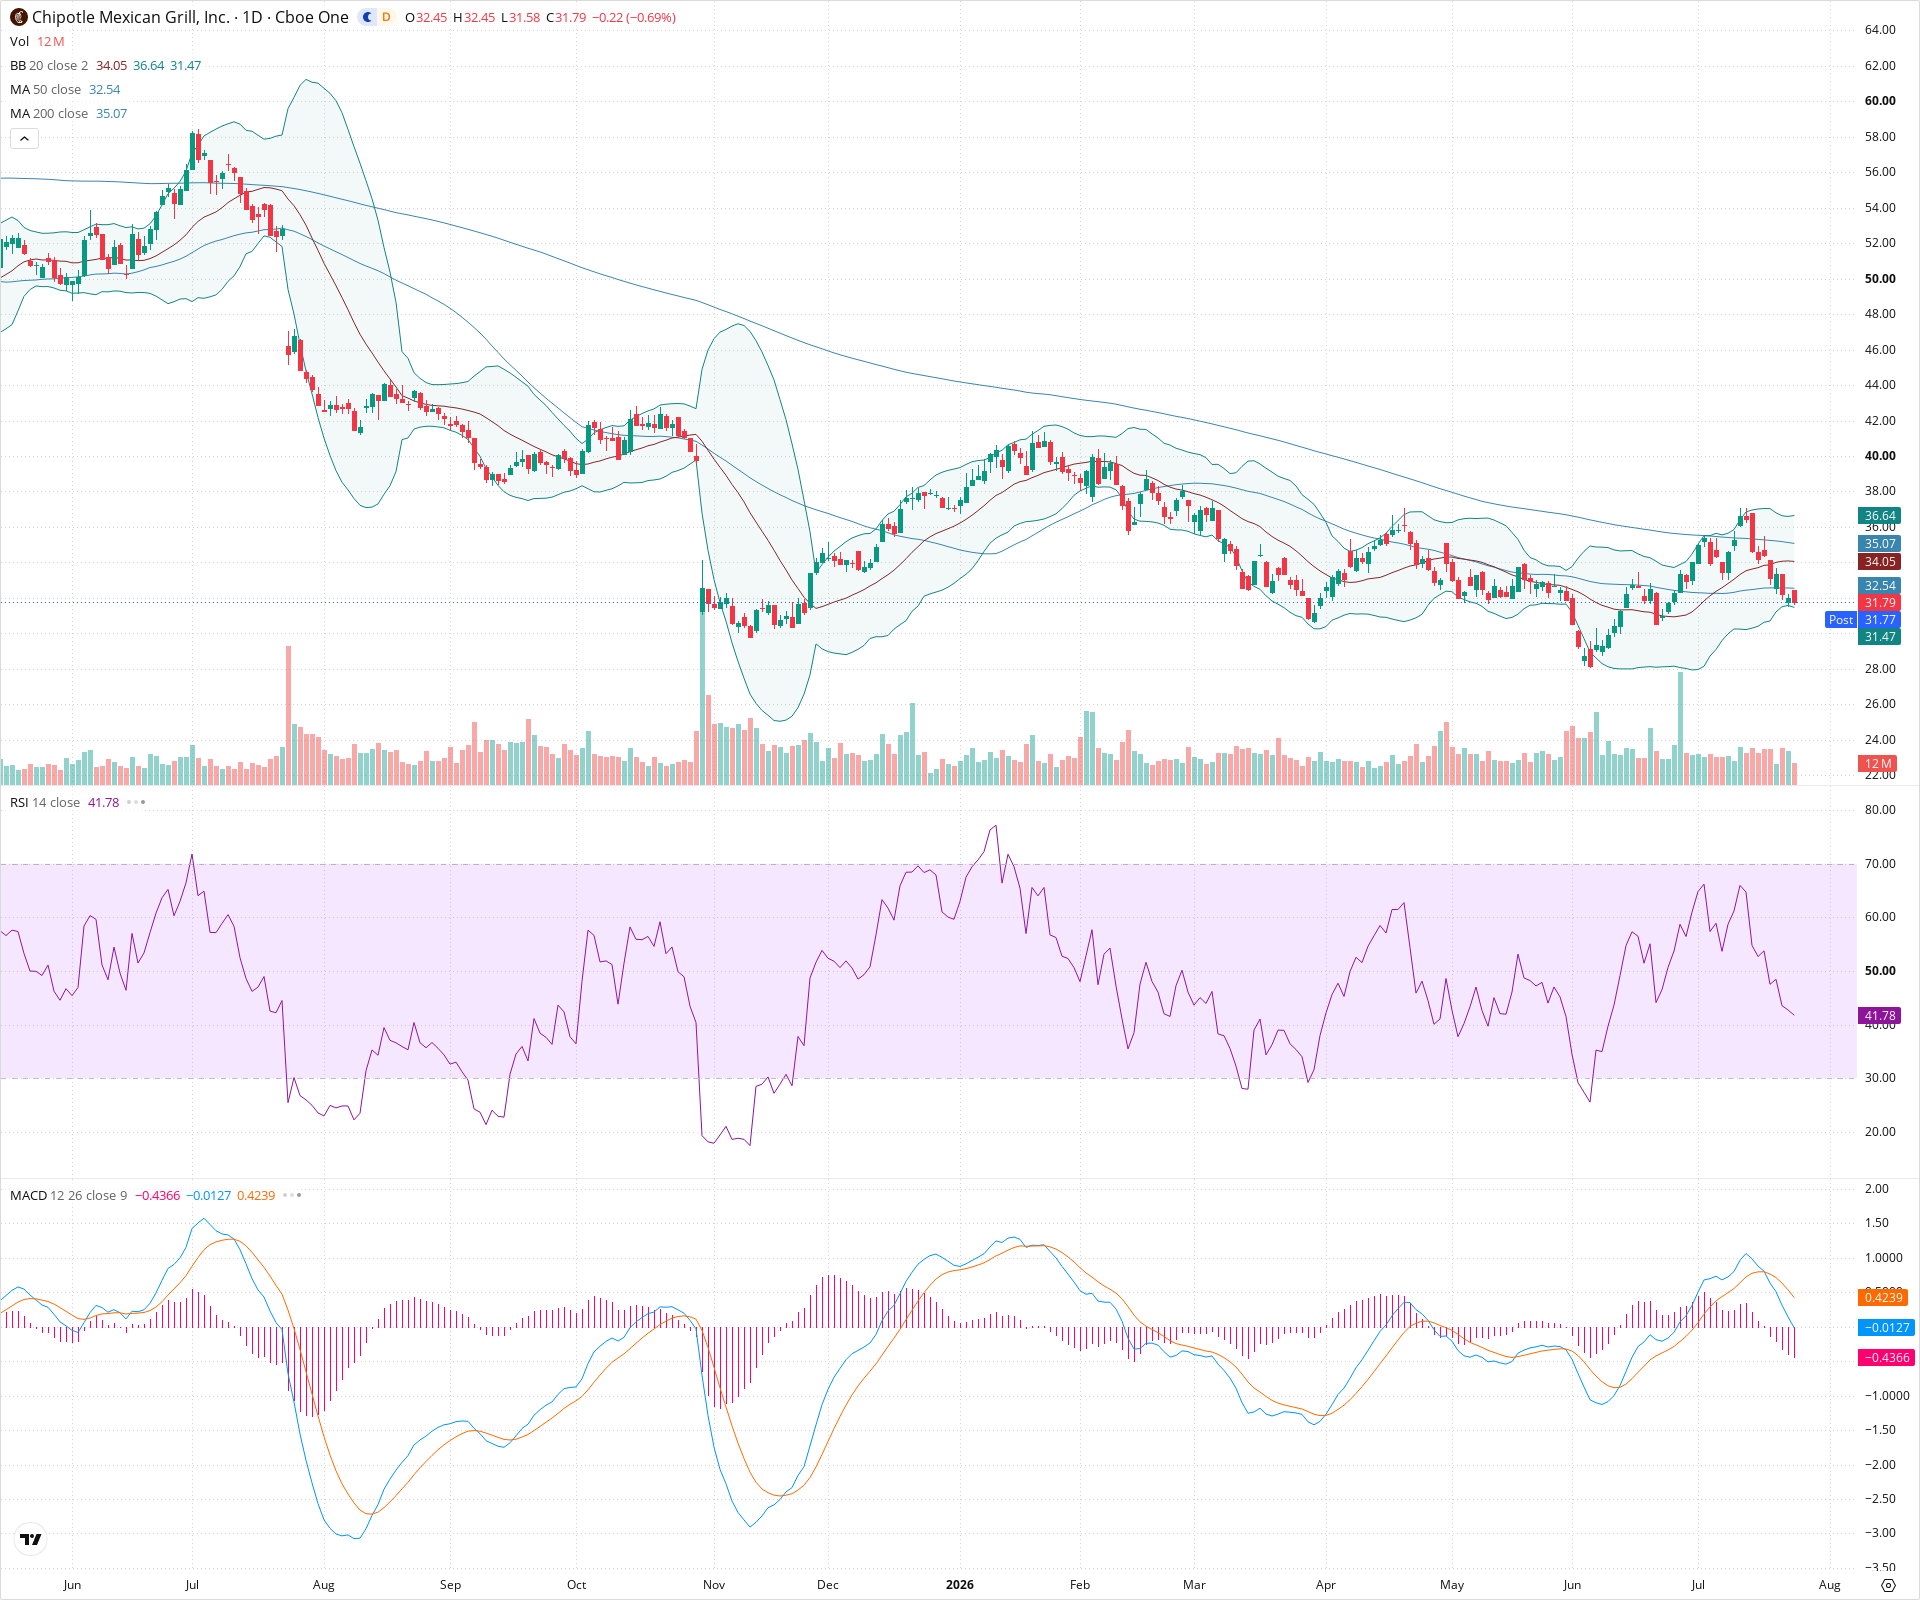
CMG remains entrenched in a prevailing long-term downtrend, consistently trading below key moving averages and forming lower highs. The recent relief rally failed at resistance near 38, leading to a sharp rollover back below the 50-day SMA. With momentum indicators turning negative, the technical picture suggests a high probability of a retest of support levels in the 28-29 range.
Included In Lists
Related Tickers of Interest
CMG Daily Chart
Sentiment
Short-term Sentiment (days to weeks): Bearish
Price has been sharply rejected from recent highs, breaking down below the 50-day SMA. A bearish MACD crossover and a falling RSI confirm accelerating downward momentum.
Long-term Sentiment (weeks to months): Bearish
The stock is in a clear, sustained downtrend, characterized by lower highs and lower lows. Price remains below a declining 200-day SMA, with the 50-day SMA positioned underneath it.
Report Metadata
- Timeframe: daily
- Generated at: 2026-07-24T21:08:15.298Z
- Model: gemini-3.1-pro-preview
Support Price Levels
| Level | Range | Strength | Notes |
|---|---|---|---|
| $28.75 | $28.00 - $29.50 | Strong | Recent significant swing lows established in April and June, serving as the next major downside target. |
| $25.25 | $24.50 - $26.00 | Strong | Major historical swing lows from the previous year, providing deep structural support. |
Resistance Price Levels
| Level | Range | Strength | Notes |
|---|---|---|---|
| $34.75 | $34.00 - $35.50 | Weak | Resistance zone near the declining 200-day SMA and recent consolidation areas. |
| $37.75 | $37.00 - $38.50 | Strong | Recent swing high that formed a strong rejection, establishing a clear ceiling for the current trend. |
Potential Chart Patterns in Formation
| Strength | Pattern | Signal | Target | Details |
|---|---|---|---|---|
| Strong | Bearish Continuation | Bearish | $28.50 | The recent rally from the 28 zone to the 38 zone appears to be a corrective bounce within a larger downtrend. The sharp reversal and break below the 50-day SMA suggest the primary downtrend is resuming. |
Frequently Asked Questions about CMG
What is the current sentiment for CMG?
The short-term sentiment for CMG is currently Bearish because Price has been sharply rejected from recent highs, breaking down below the 50-day SMA. A bearish MACD crossover and a falling RSI confirm accelerating downward momentum.. The long-term trend is classified as Bearish.
What are the key support levels for CMG?
StockDips.AI has identified key support levels for CMG at $28.75 and $25.25. These levels may represent potential accumulation zones where buying interest could emerge.
Is CMG in a significant dip or a Value Dip right now?
CMG has a Value Score of 49/100. It is not currently flagged as a significant dip in the Top Dips list. It is not listed as a Value Dip because the long-term sentiment or value-score threshold does not qualify.
View the full interactive analysis on StockDips.AI.