CMG Monthly Technical Analysis
Chipotle Mexican Grill
Fast-casual restaurant chain serving customizable Mexican-inspired meals.
CMG Technical Analysis Summary
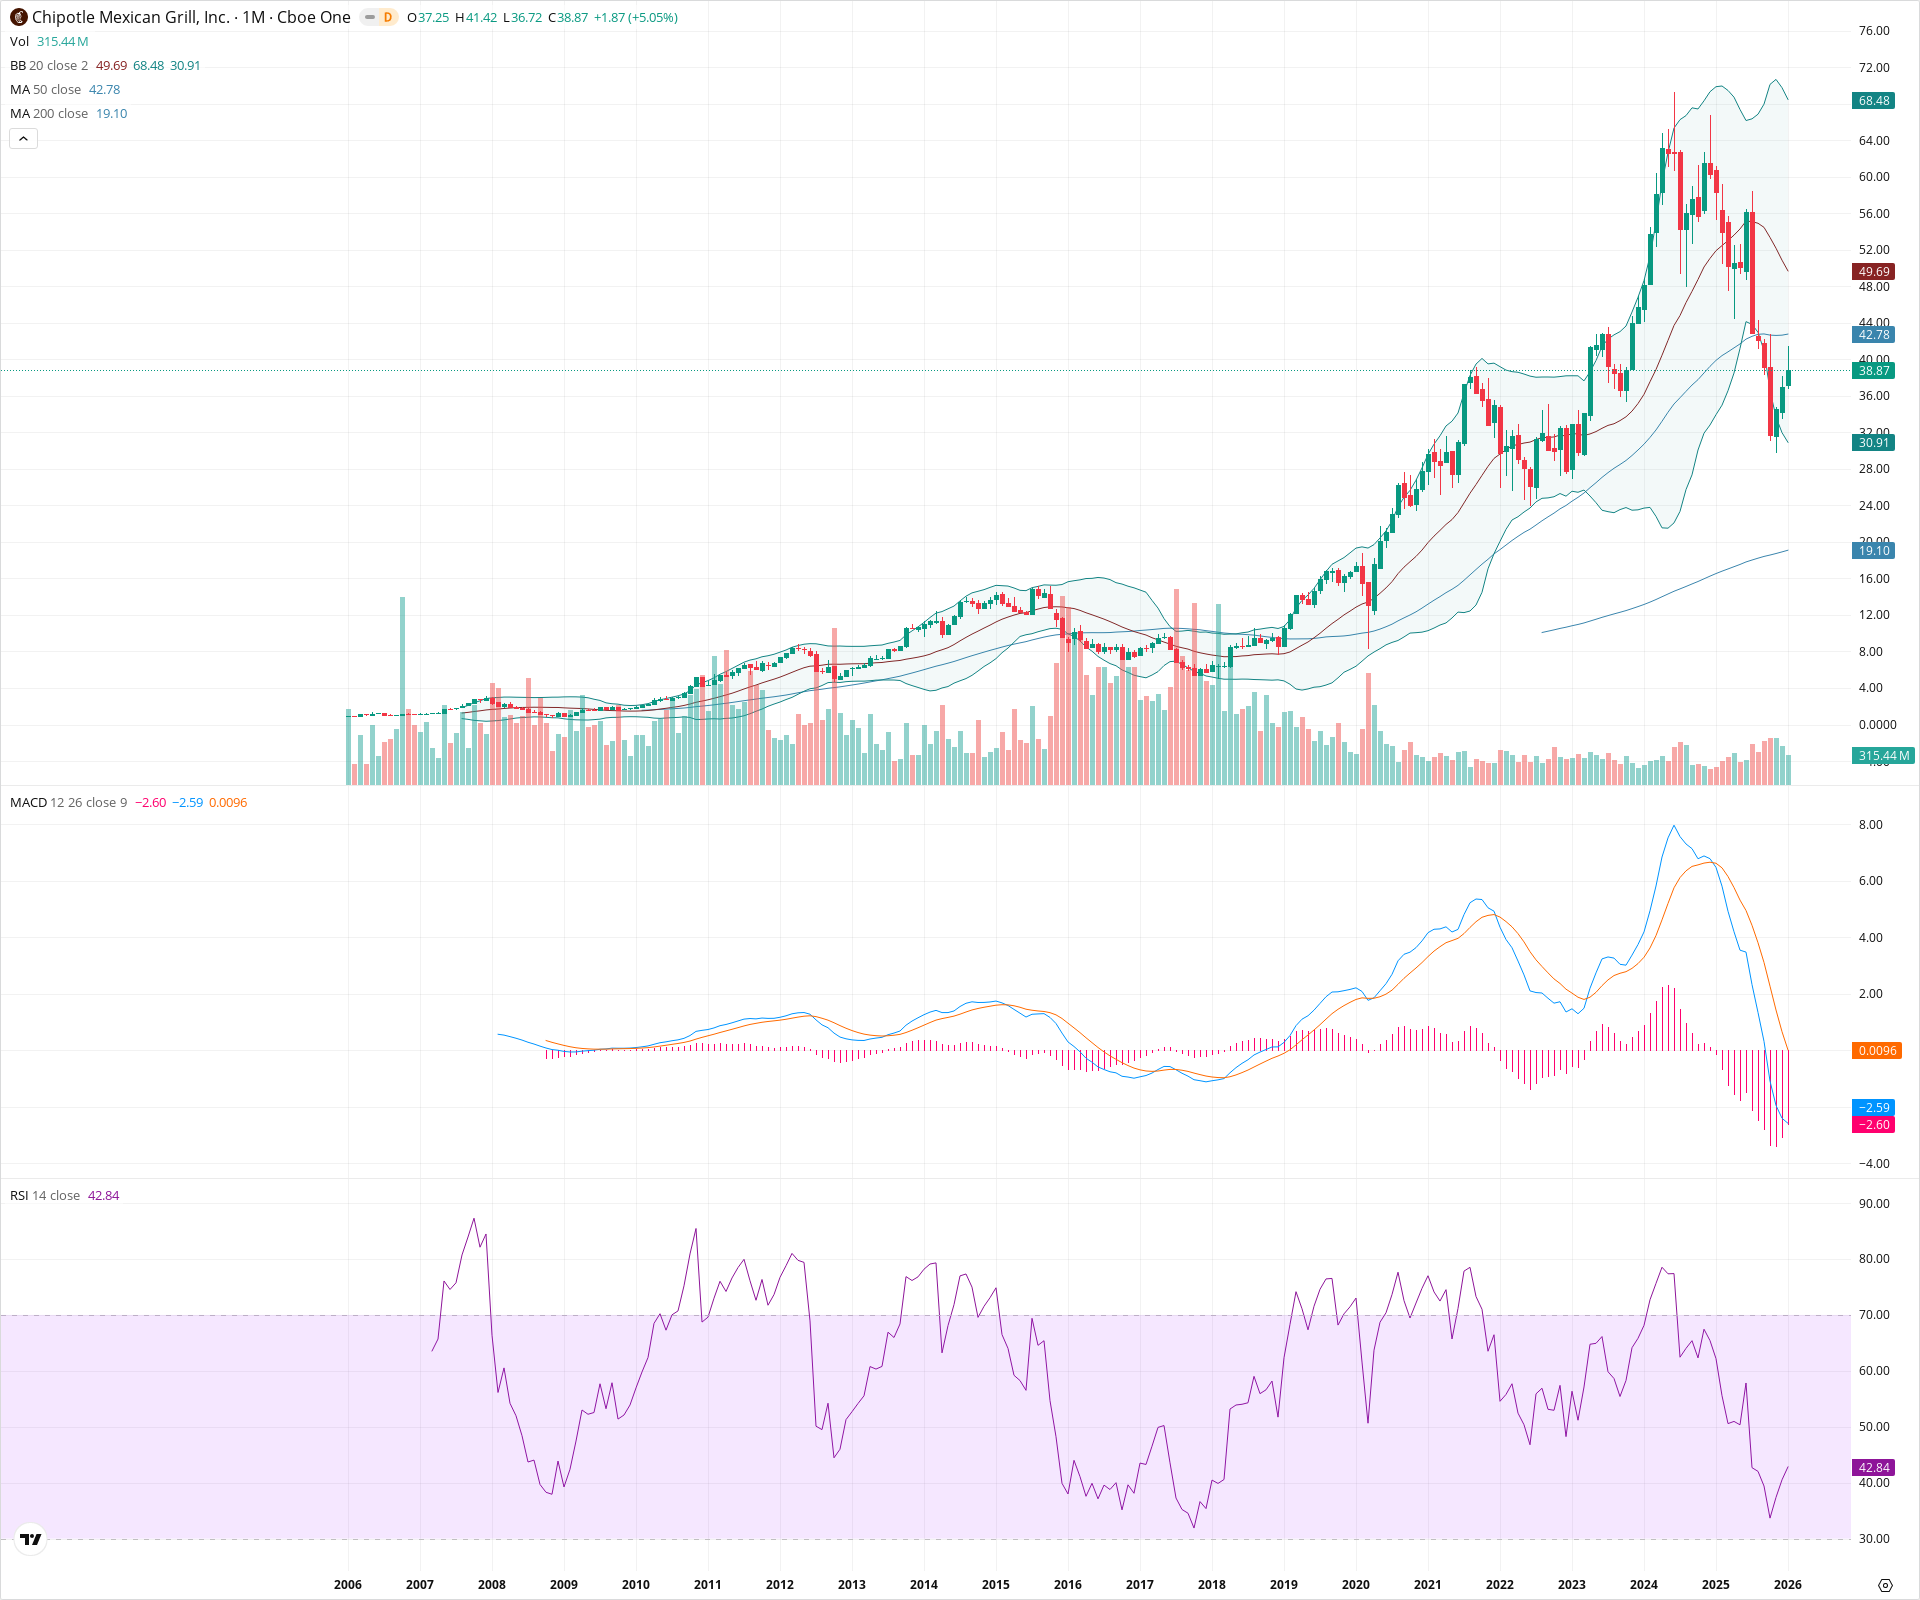
CMG is currently in a corrective phase within its long-term history, having retraced significantly from all-time highs and lost support at the 50-month SMA. While short-term indicators show signs of stabilization and a potential momentum shift near the 38.00 level, the overarching structure remains bearish below the 43.00-50.00 resistance zone. Long-term investors should watch for a definitive reclaim of the 50-month SMA or a test of the 200-month SMA for clearer directional cues.
Included In Lists
Related Tickers of Interest
CMG Monthly Chart
Sentiment
Short-term Sentiment (days to weeks): Neutral
Price is stabilizing and attempting a bounce, with the MACD histogram turning marginally positive (0.0096), suggesting waning selling momentum. However, the price remains below immediate resistance at the 50-month SMA.
Long-term Sentiment (weeks to months): Bearish
The stock has suffered a deep correction from highs (~68.00), breaking the structural uptrend and trading below the 20-month and 50-month SMAs. The long-term trend is damaged unless these levels are reclaimed.
Report Metadata
- Timeframe: monthly
- Generated at: 2026-02-02T05:30:30.453Z
- Model: gemini-3-pro-preview
Support Price Levels
| Level | Range | Strength | Notes |
|---|---|---|---|
| $31.46 | $30.91 - $32.00 | Strong | Coincides with the Lower Bollinger Band and a significant consolidation zone from prior years. |
| $19.55 | $19.10 - $20.00 | Strong | Major secular support at the 200-month SMA. |
Resistance Price Levels
| Level | Range | Strength | Notes |
|---|---|---|---|
| $43.39 | $42.78 - $44.00 | Strong | 50-month SMA and previous breakdown level serving as immediate overhead resistance. |
| $50.85 | $49.69 - $52.00 | Strong | 20-month SMA (Bollinger Basis) and midpoint of the broader range. |
| $68.50 | $68.00 - $69.00 | Strong | All-time high structural resistance. |
Potential Chart Patterns in Formation
| Strength | Pattern | Signal | Target | Details |
|---|---|---|---|---|
| Strong | Secular Downtrend | Bearish | N/A | A clear series of lower highs and lower lows established from the peak near 68.00, confirming a regime change from the prior bull run. |
Frequently Asked Questions about CMG
What is the current sentiment for CMG?
The short-term sentiment for CMG is currently Neutral because Price is stabilizing and attempting a bounce, with the MACD histogram turning marginally positive (0.0096), suggesting waning selling momentum. However, the price remains below immediate resistance at the 50-month SMA.. The long-term trend is classified as Bearish.
What are the key support levels for CMG?
StockDips.AI has identified key support levels for CMG at $31.46 and $19.55. These levels may represent potential accumulation zones where buying interest could emerge.
Is CMG in a significant dip or a Value Dip right now?
CMG has a Value Score of 49/100. It is not currently flagged as a significant dip in the Top Dips list. It is not listed as a Value Dip because the long-term sentiment or value-score threshold does not qualify.
View the full interactive analysis on StockDips.AI.