CRSP Monthly Technical Analysis
CRISPR Therapeutics AG
A biotechnology company that develops gene-based medicines.
CRSP Technical Analysis Summary
CRSP is currently navigating a prolonged secular base, trading sideways between major support around $40 and resistance near $90. The monthly MACD shows improving momentum with a bullish crossover below the zero line, suggesting the worst of the bear market is over, but price action remains capped by the 50-month SMA. A sustained breakout above the $90 level or a breakdown below $40 is required to define the next major long-term trend.
Included In Lists
Related Tickers of Interest
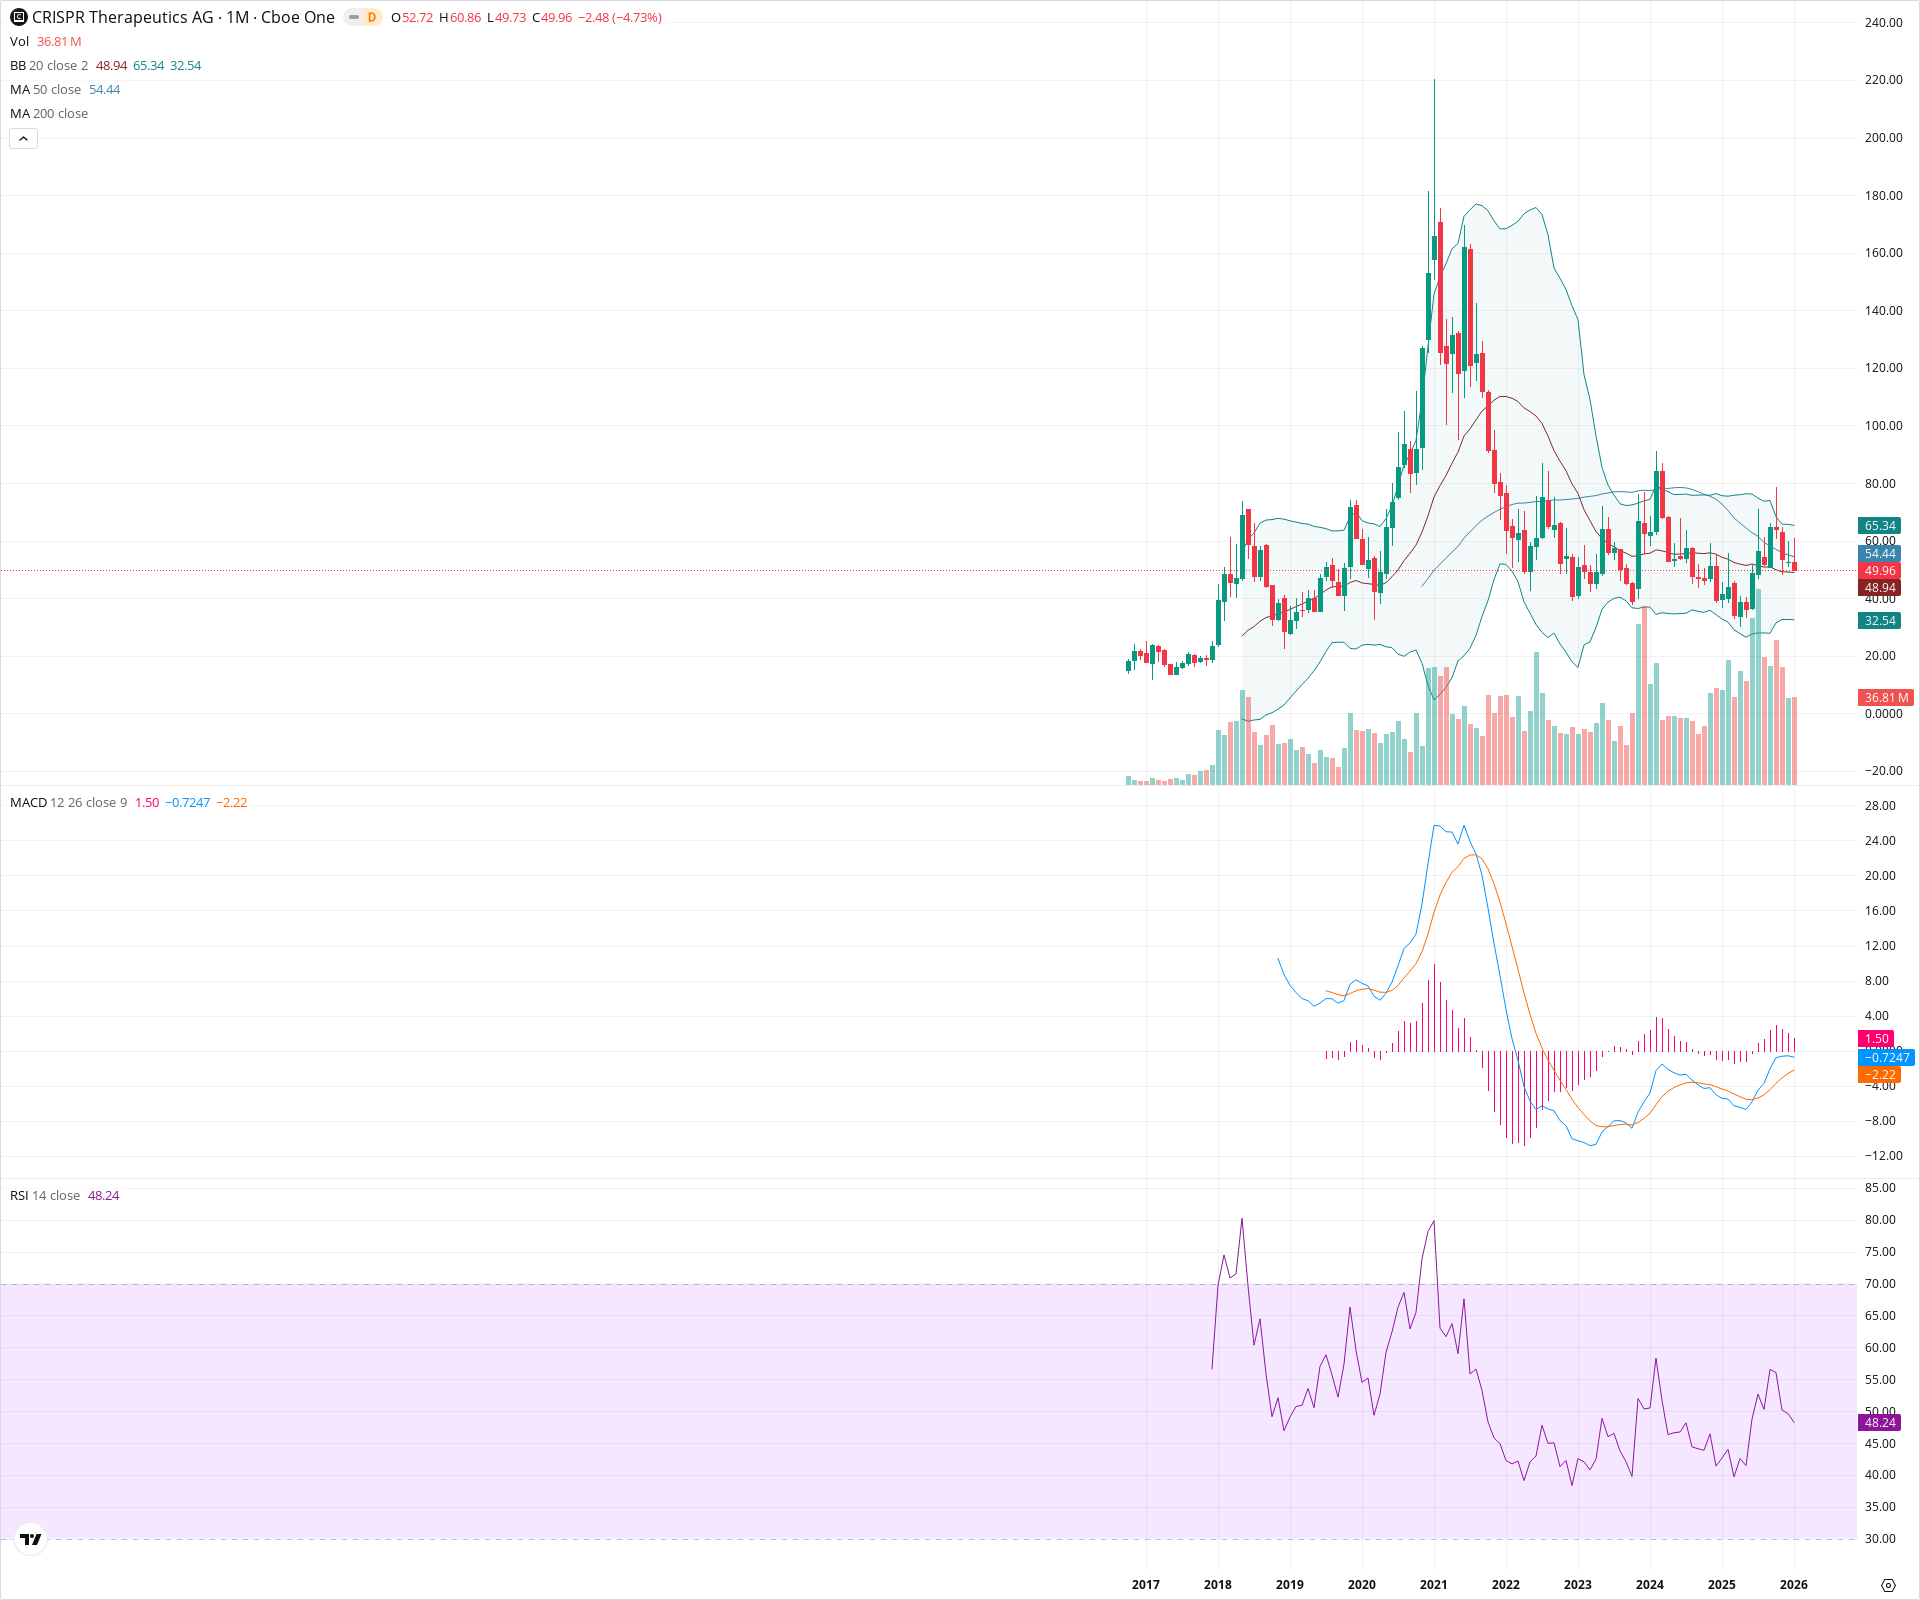
CRSP Monthly Chart
Sentiment
Short-term Sentiment (days to weeks): Neutral
Price is trading within a consolidation range, currently resting near the 20-month SMA support after a pullback. The RSI is near 50, indicating a lack of strong directional momentum in the near term.
Long-term Sentiment (weeks to months): Neutral
The stock has been forming a massive multi-year base since 2022, stabilizing after a major decline. While the MACD has crossed bullishly, price remains below the 50-month SMA and trapped in a wide sideways range, indicating a transitional stage 1 accumulation phase rather than a confirmed bull trend.
Report Metadata
- Timeframe: monthly
- Generated at: 2026-02-02T05:31:05.810Z
- Model: gemini-3-pro-preview
Support Price Levels
| Level | Range | Strength | Notes |
|---|---|---|---|
| $40.00 | $38.00 - $42.00 | Strong | Major secular support zone formed by the multi-year lows in 2022 and 2023. |
| $33.50 | $32.00 - $35.00 | Weak | Proximity to the current lower Bollinger Band and historical support from 2019. |
Resistance Price Levels
| Level | Range | Strength | Notes |
|---|---|---|---|
| $54.72 | $54.44 - $55.00 | Weak | Immediate resistance at the 50-month SMA. |
| $87.50 | $85.00 - $90.00 | Strong | Upper boundary of the multi-year consolidation channel; recent swing highs from early 2024. |
Potential Chart Patterns in Formation
| Strength | Pattern | Signal | Target | Details |
|---|---|---|---|---|
| Strong | Secular Base / Rectangle | Neutral | N/A | Price has been oscillating in a clearly defined horizontal range between roughly $40 and $90 for over two years. |
Frequently Asked Questions about CRSP
What is the current sentiment for CRSP?
The short-term sentiment for CRSP is currently Neutral because Price is trading within a consolidation range, currently resting near the 20-month SMA support after a pullback. The RSI is near 50, indicating a lack of strong directional momentum in the near term.. The long-term trend is classified as Neutral.
What are the key support levels for CRSP?
StockDips.AI has identified key support levels for CRSP at $40.00 and $33.50. These levels may represent potential accumulation zones where buying interest could emerge.
Is CRSP in a significant dip or a Value Dip right now?
CRSP has a Value Score of 66/100. It is not currently flagged as a significant dip in the Top Dips list. It is not listed as a Value Dip because the long-term sentiment or value-score threshold does not qualify.
View the full interactive analysis on StockDips.AI.