DNUT Weekly Technical Analysis
Krispy Kreme, Inc.
Iconic doughnut and baked-goods brand with global distribution through stores, retailers, and fresh-daily delivery hubs.
DNUT Technical Analysis Summary
DNUT remains entrenched in a powerful long-term downtrend. A recent attempt at a relief rally from extreme lows was firmly rejected by the declining 50-week SMA. With short-term momentum indicators like MACD and RSI turning bearish again, the path of least resistance appears to be lower. The stock would need to build a significant base and reclaim its major moving averages to suggest any structural trend change.
Included In Lists
Related Tickers of Interest
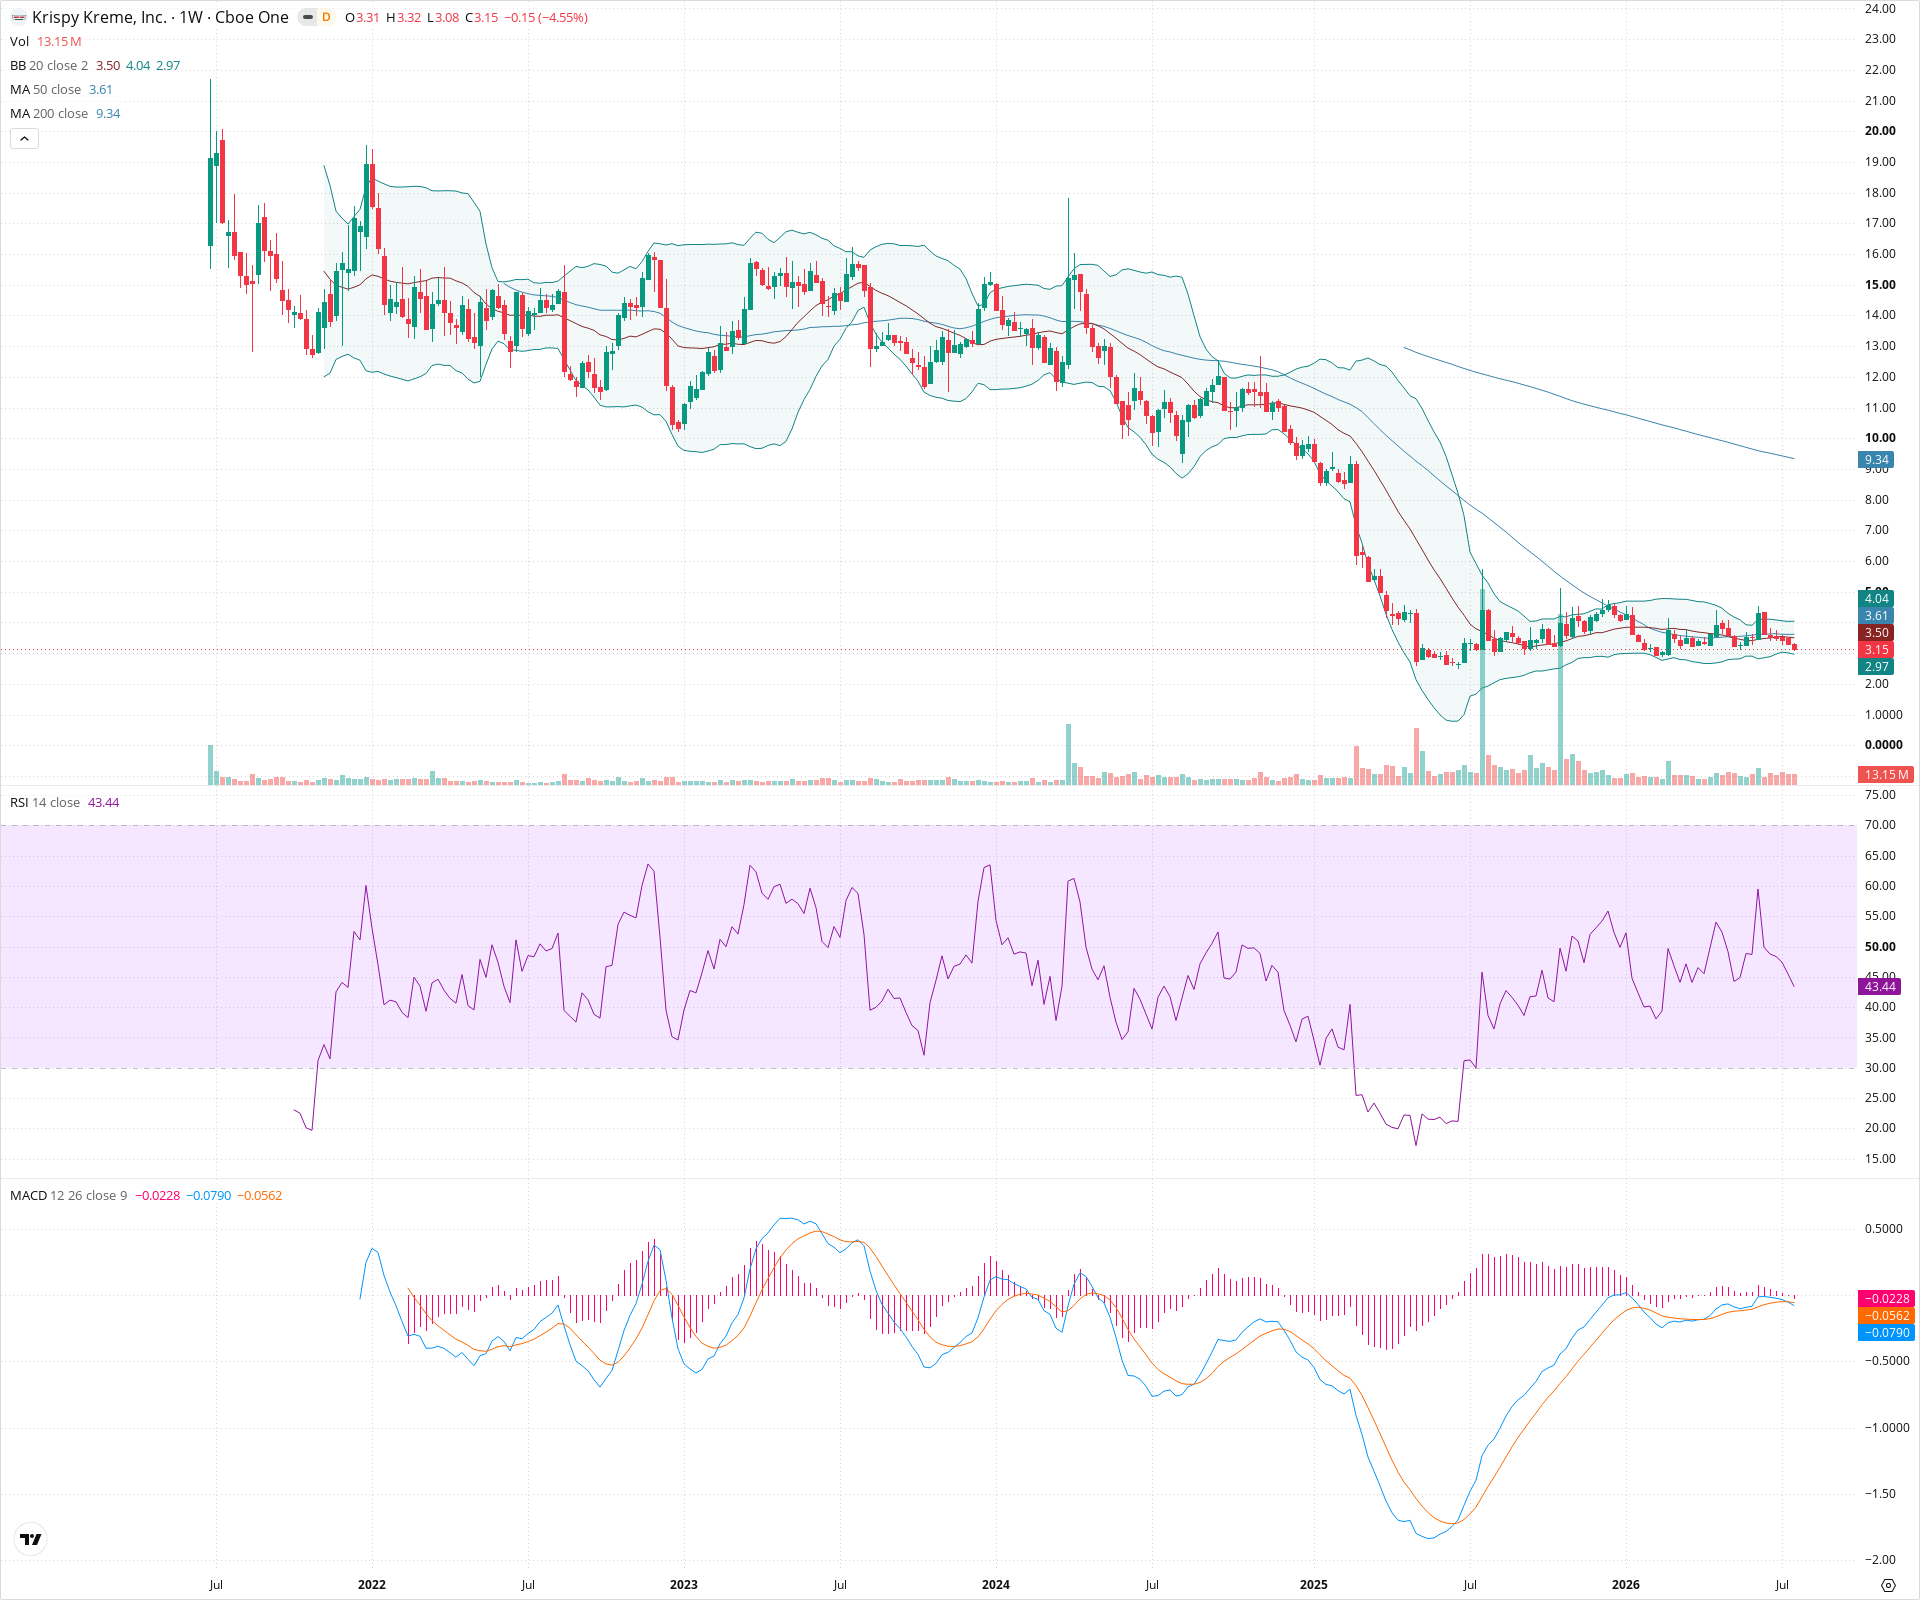
DNUT Weekly Chart
Sentiment
Short-term Sentiment (days to weeks): Bearish
Price recently failed to break above the declining 50-week SMA, formed a lower high, and has broken back below the 20-week SMA. MACD has crossed bearish with a growing negative histogram, and RSI is back below 50, indicating returning downside momentum.
Long-term Sentiment (weeks to months): Bearish
The stock is in a severe, multi-year downtrend. Price remains significantly below a steeply declining 200-week SMA, and the 50-week SMA is well below the 200-week SMA, confirming a dominant bearish regime.
Report Metadata
- Timeframe: weekly
- Generated at: 2026-07-25T09:11:14.399Z
- Model: gemini-3.1-pro-preview
Support Price Levels
| Level | Range | Strength | Notes |
|---|---|---|---|
| $2.00 | $1.80 - $2.20 | Strong | The all-time low zone established after a massive capitulation sell-off. This is the ultimate line in the sand for long-term support. |
Resistance Price Levels
| Level | Range | Strength | Notes |
|---|---|---|---|
| $3.65 | $3.50 - $3.80 | Strong | Confluence of the 20-week SMA (middle Bollinger Band) and the 50-week SMA, which recently acted as dynamic resistance. |
| $4.85 | $4.50 - $5.20 | Strong | The peak of the recent counter-trend relief rally. |
Potential Chart Patterns in Formation
| Strength | Pattern | Signal | Target | Details |
|---|---|---|---|---|
| Strong | Failed Relief Rally / Dead Cat Bounce | Bearish | N/A | After a precipitous drop to roughly $2.00, the stock experienced a sharp counter-trend rally. This rally failed precisely at the 50-week SMA, and price action is rolling over, suggesting the prior bounce was merely a temporary reprieve in an ongoing downtrend. |
Frequently Asked Questions about DNUT
What is the current sentiment for DNUT?
The short-term sentiment for DNUT is currently Bearish because Price recently failed to break above the declining 50-week SMA, formed a lower high, and has broken back below the 20-week SMA. MACD has crossed bearish with a growing negative histogram, and RSI is back below 50, indicating returning downside momentum.. The long-term trend is classified as Bearish.
What are the key support levels for DNUT?
StockDips.AI has identified key support levels for DNUT at $2.00. These levels may represent potential accumulation zones where buying interest could emerge.
Is DNUT in a significant dip or a Value Dip right now?
DNUT has a Value Score of 73/100. It is currently flagged as a significant dip in the Top Dips list. It is not listed as a Value Dip because the long-term sentiment or value-score threshold does not qualify.
View the full interactive analysis on StockDips.AI.