DNUT Monthly Technical Analysis
Krispy Kreme, Inc.
Iconic doughnut and baked-goods brand with global distribution through stores, retailers, and fresh-daily delivery hubs.
DNUT Technical Analysis Summary
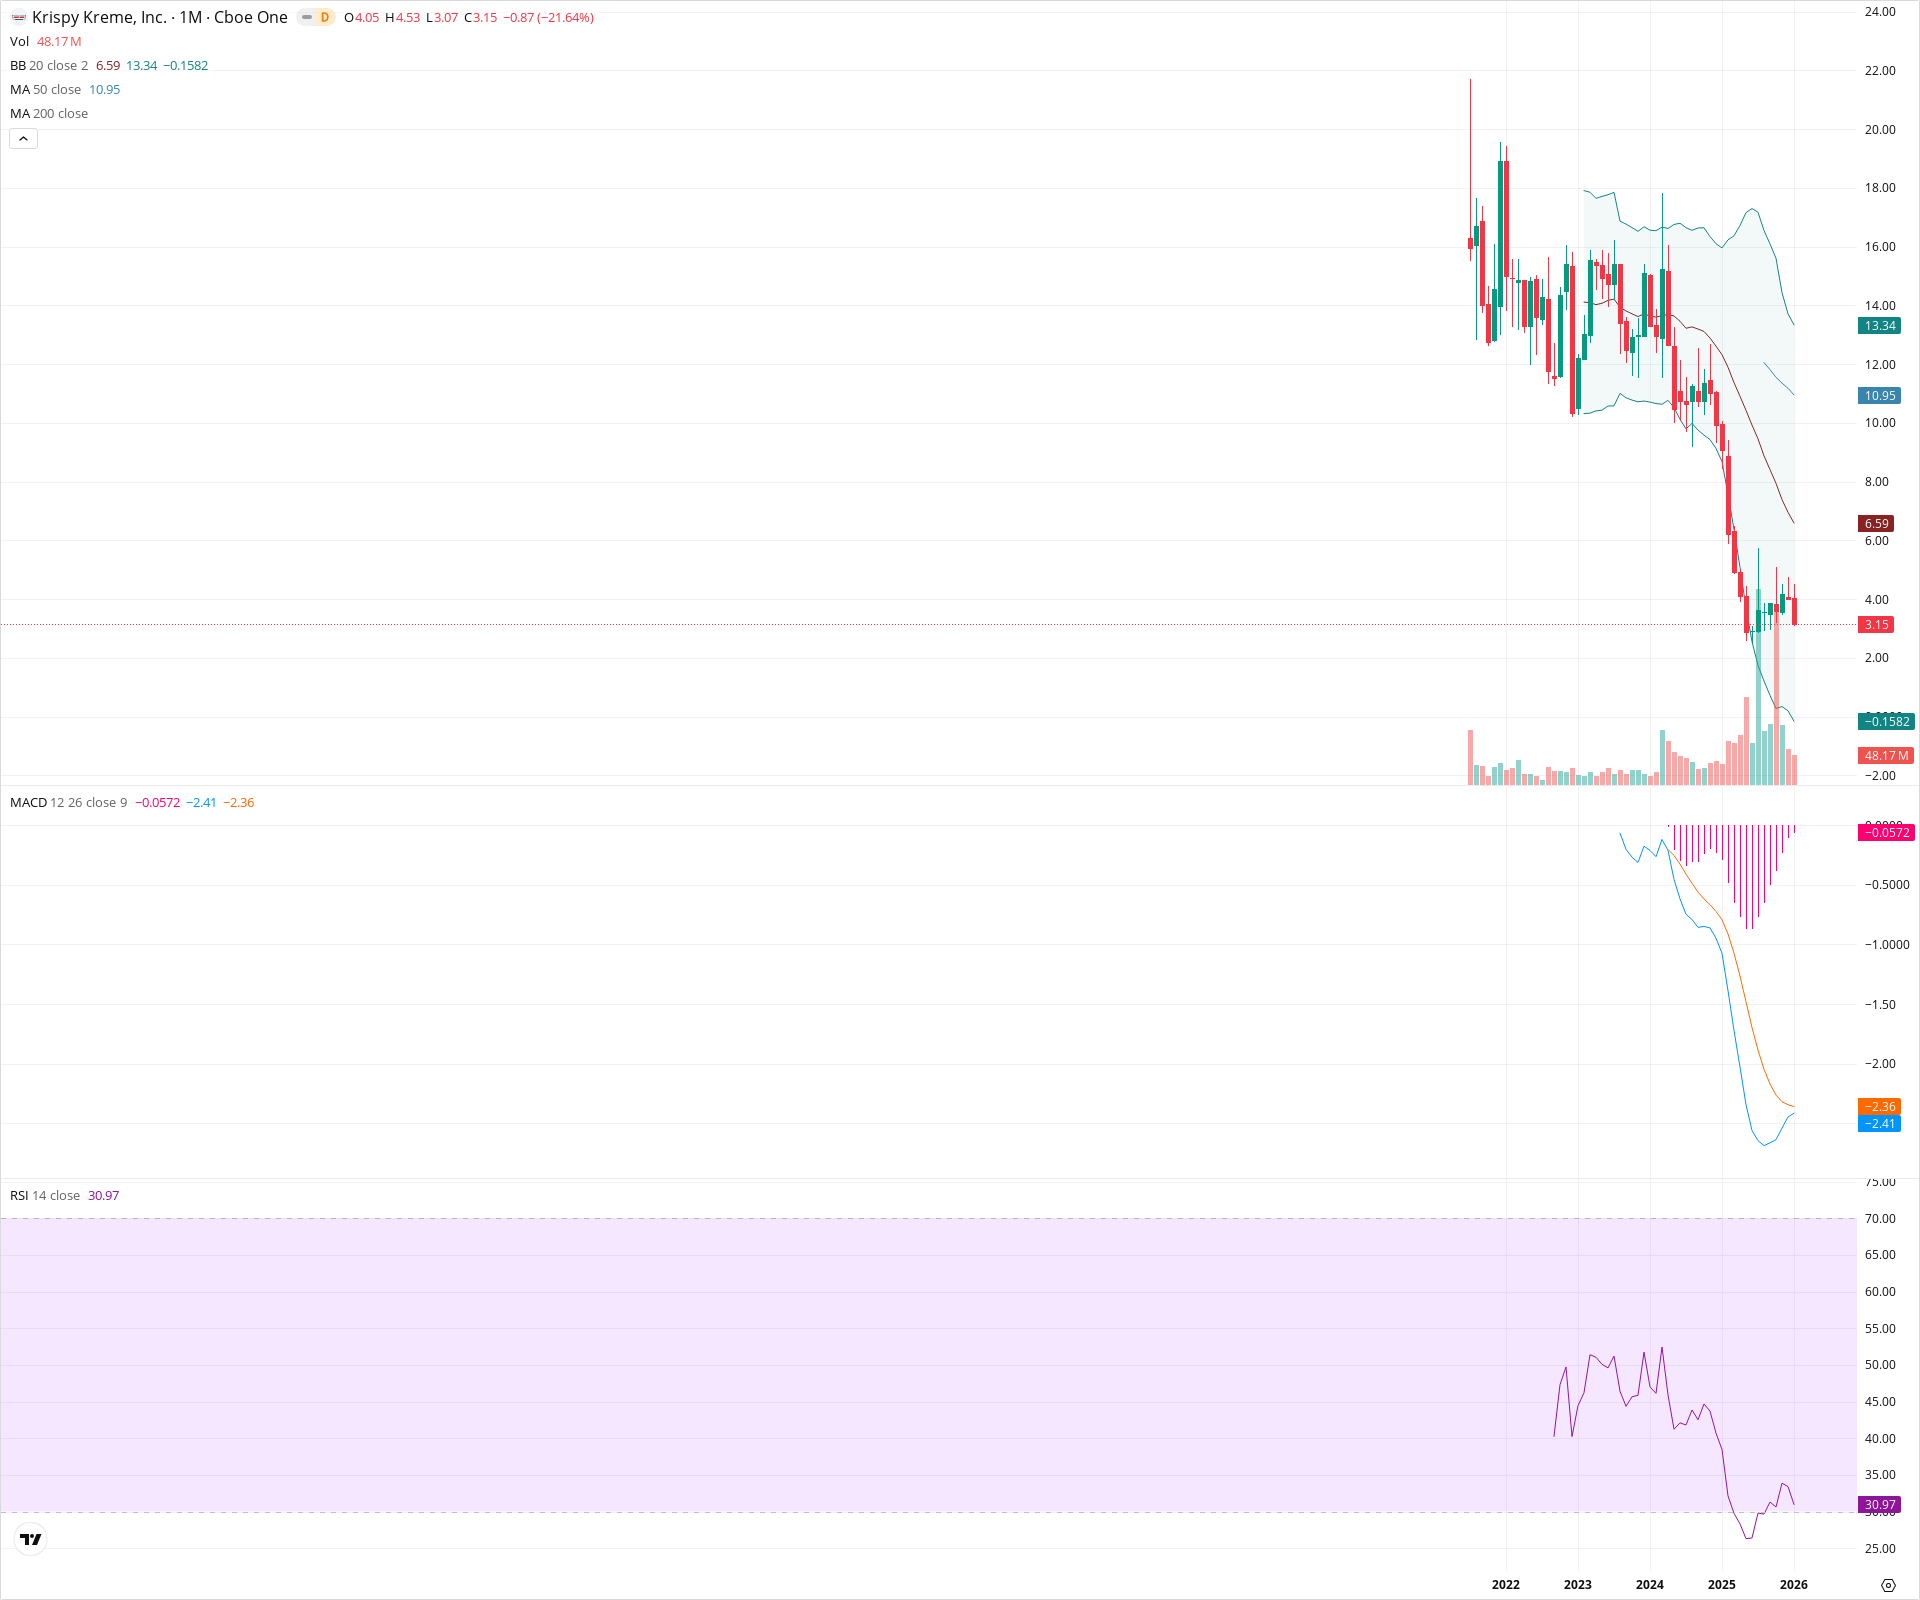
Krispy Kreme (DNUT) is experiencing a catastrophic technical breakdown, trading at all-time lows with intense bearish momentum. The monthly MACD is diving deeply into negative territory with an expanding histogram, confirming the strength of the downtrend, while volume spikes suggest capitulation is underway. Although the RSI is approaching oversold levels (~31), the lack of any stabilization pattern or base suggests the bottom has not yet been formed.
Included In Lists
Related Tickers of Interest
DNUT Monthly Chart
Sentiment
Short-term Sentiment (days to weeks): Bearish
The price has dropped over 21% this month alone, printing a large bearish candle with expanding volume and hitting fresh lows.
Long-term Sentiment (weeks to months): Bearish
The stock is in a confirmed secular downtrend, trading significantly below declining 20 and 50-month SMAs, having broken all major historical support structures.
Report Metadata
- Timeframe: monthly
- Generated at: 2026-02-02T06:23:22.111Z
- Model: gemini-3-pro-preview
Support Price Levels
| Level | Range | Strength | Notes |
|---|---|---|---|
| $3.07 | $3.07 - $3.07 | Weak | Current monthly low; strictly immediate intra-month support. |
| $2.75 | $2.50 - $3.00 | Weak | Psychological support zone as the stock enters price discovery at all-time lows. |
Resistance Price Levels
| Level | Range | Strength | Notes |
|---|---|---|---|
| $6.80 | $6.59 - $7.00 | Strong | Dynamic resistance at the 20-month SMA and the general area of the most recent breakdown. |
| $11.00 | $10.00 - $12.00 | Strong | Major structural resistance zone representing the multi-year floor that was broken in 2024. |
Potential Chart Patterns in Formation
| Strength | Pattern | Signal | Target | Details |
|---|---|---|---|---|
| Strong | Capitulation / Parabolic Downtrend | Bearish | N/A | A vertical price decline accompanied by a massive spike in volume and widening Bollinger Bands, indicating panic selling and a lack of buyers. |
Frequently Asked Questions about DNUT
What is the current sentiment for DNUT?
The short-term sentiment for DNUT is currently Bearish because The price has dropped over 21% this month alone, printing a large bearish candle with expanding volume and hitting fresh lows.. The long-term trend is classified as Bearish.
What are the key support levels for DNUT?
StockDips.AI has identified key support levels for DNUT at $3.07 and $2.75. These levels may represent potential accumulation zones where buying interest could emerge.
Is DNUT in a significant dip or a Value Dip right now?
DNUT has a Value Score of 73/100. It is currently flagged as a significant dip in the Top Dips list. It is not listed as a Value Dip because the long-term sentiment or value-score threshold does not qualify.
View the full interactive analysis on StockDips.AI.