EEM Monthly Technical Analysis
Emerging Markets ETF
iShares MSCI Exchange-Traded Fund designed to track the performance of large- and mid-cap stocks across emerging market countries, including China, Taiwan, India, Brazil, and South Africa. Often used as a macro indicator for global risk appetite and emerging-market sentiment.
EEM Technical Analysis Summary
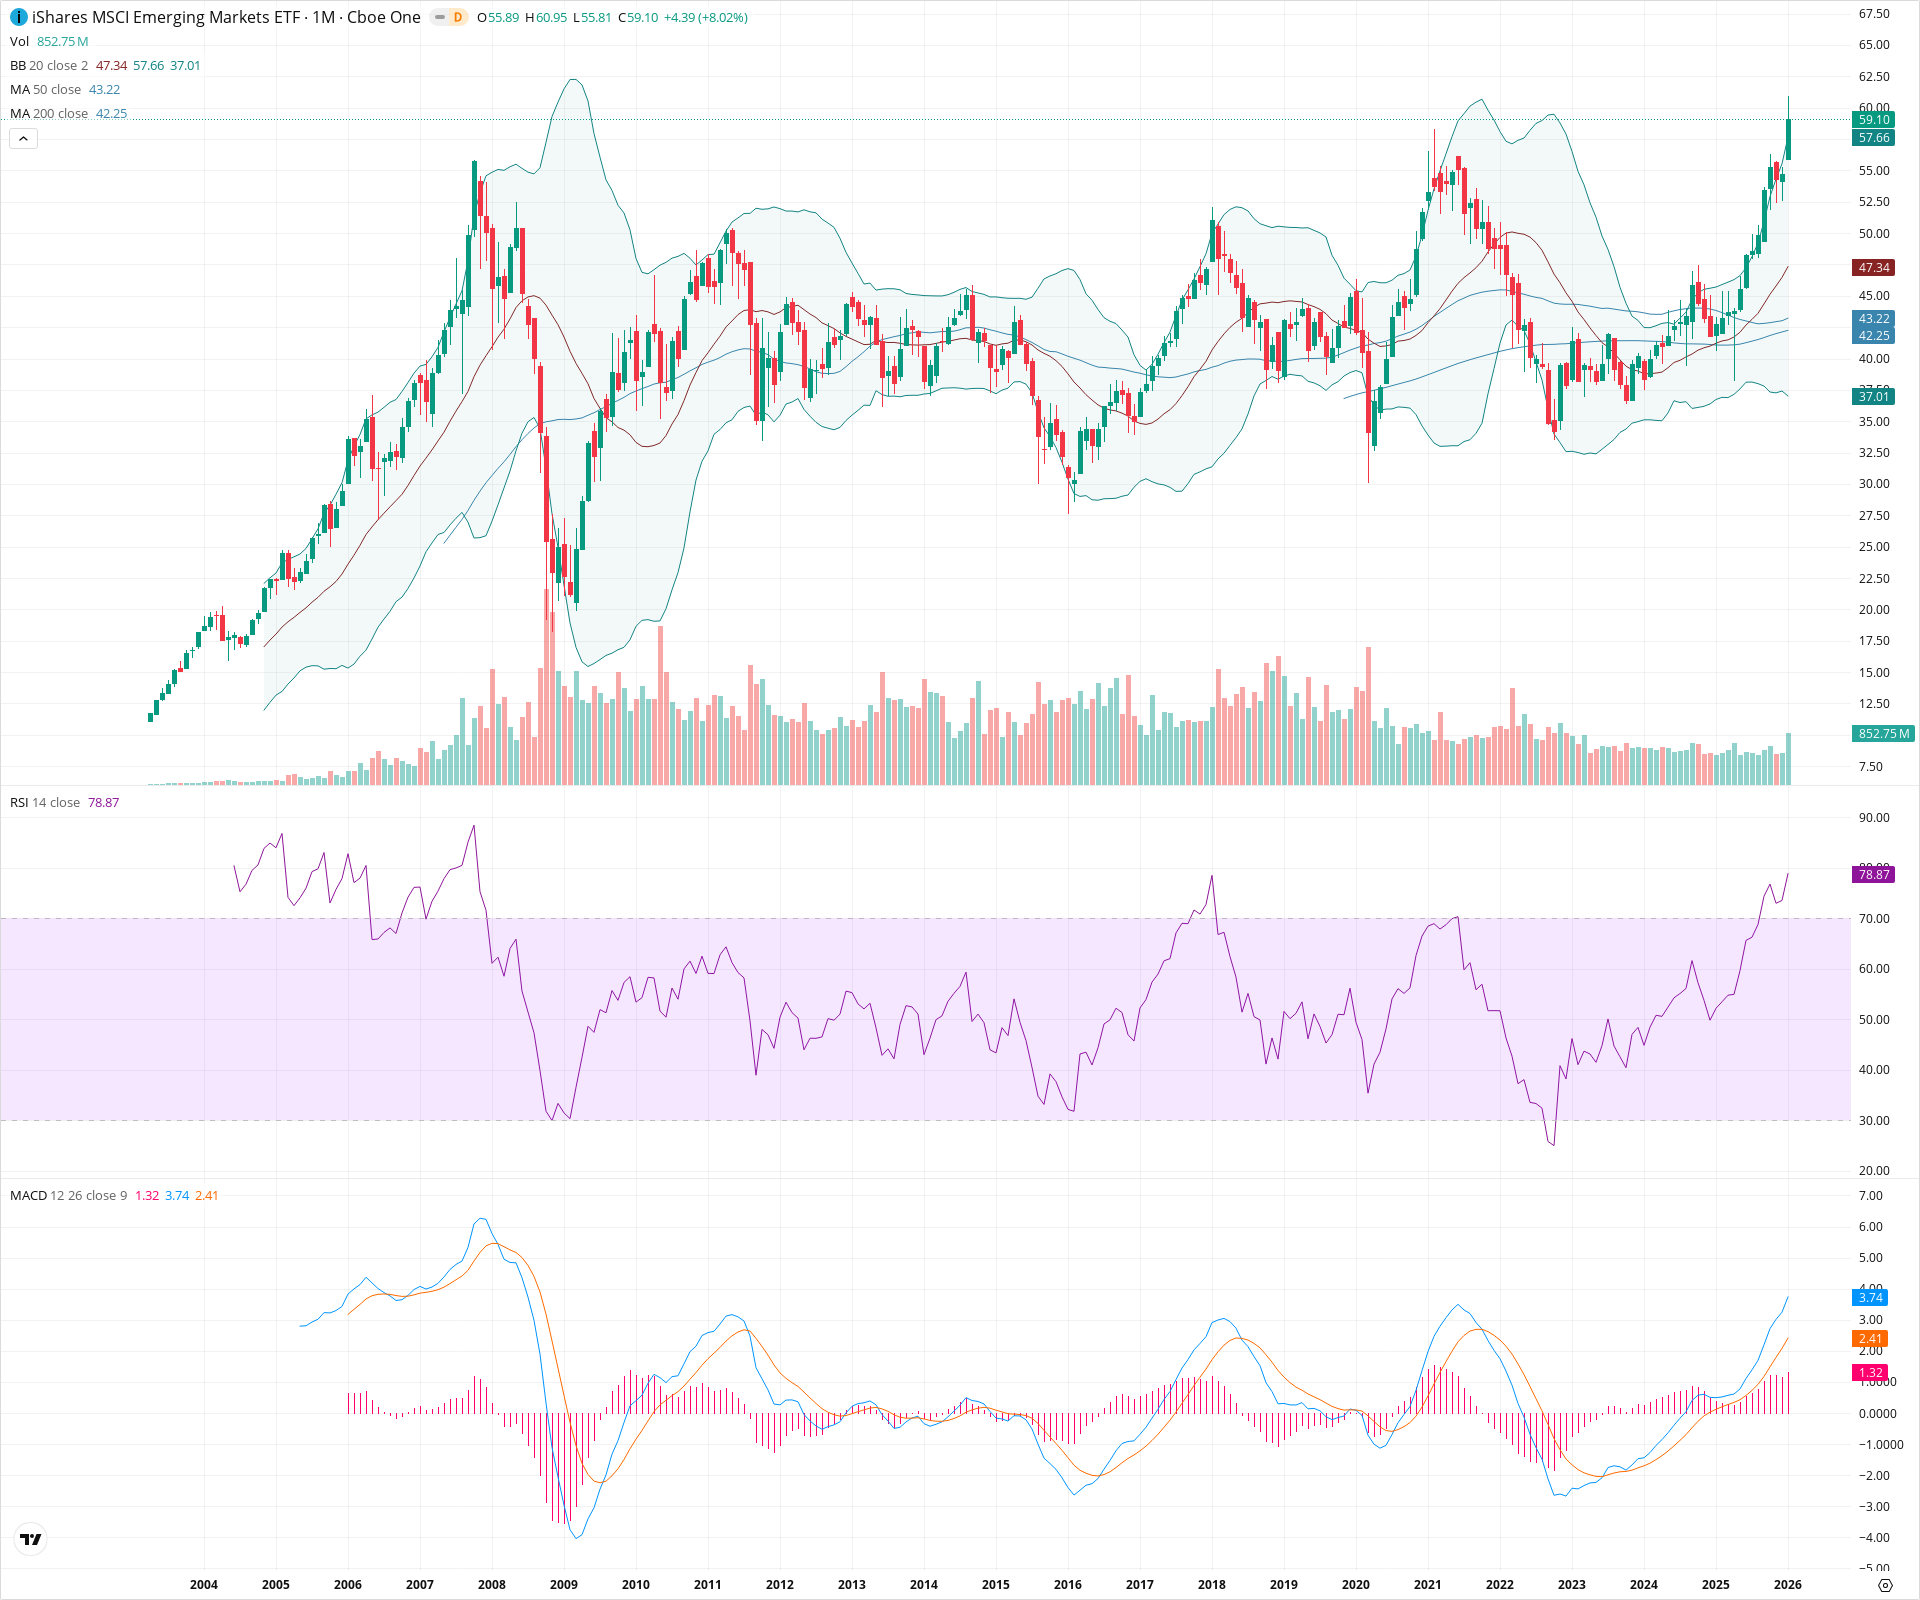
EEM is currently staging a significant technical event by challenging the upper bound of a 15-year consolidation range near the 60.00 level. Momentum indicators are stretched but strongly bullish, with the MACD confirming a robust long-term trend expansion. A sustained monthly close above 60.00 would confirm a secular breakout into price discovery, ending a decade-long sideways regime.
Included In Lists
Related Tickers of Interest
EEM Monthly Chart
Sentiment
Short-term Sentiment (days to weeks): Bullish
Price has produced a strong green monthly candle breaking above the upper Bollinger Band, accompanied by a high RSI of ~79, indicating intense upward momentum.
Long-term Sentiment (weeks to months): Bullish
The asset is challenging and piercing multi-decade structural resistance around the 55-60 level. MACD is in a strong bullish expansion above the zero line, and price is well above rising 20, 50, and 200-month SMAs.
Report Metadata
- Timeframe: monthly
- Generated at: 2026-02-02T04:03:38.740Z
- Model: gemini-3-pro-preview
Support Price Levels
| Level | Range | Strength | Notes |
|---|---|---|---|
| $51.25 | $50.00 - $52.50 | Strong | Former major resistance zone spanning multiple peaks (2018, 2021) now acting as a breakout support floor. |
| $44.75 | $42.00 - $47.50 | Strong | Confluence of the 20-month SMA, 50-month SMA, and 200-month SMA providing deep structural support. |
| $36.00 | $35.00 - $37.00 | Strong | Major secular lows established during the 2022 base formation. |
Resistance Price Levels
| Level | Range | Strength | Notes |
|---|---|---|---|
| $60.00 | $59.00 - $61.00 | Strong | Historical all-time high zone dating back to peaks in 2007 and 2021. Price is currently testing/breaking this ceiling. |
Potential Chart Patterns in Formation
| Strength | Pattern | Signal | Target | Details |
|---|---|---|---|---|
| Strong | Secular Range Breakout | Bullish | N/A | Price is attempting to break out of a massive multi-year consolidation range (approx. 30-60) that has contained price action since 2011. |
Frequently Asked Questions about EEM
What is the current sentiment for EEM?
The short-term sentiment for EEM is currently Bullish because Price has produced a strong green monthly candle breaking above the upper Bollinger Band, accompanied by a high RSI of ~79, indicating intense upward momentum.. The long-term trend is classified as Bullish.
What are the key support levels for EEM?
StockDips.AI has identified key support levels for EEM at $51.25 and $44.75. These levels may represent potential accumulation zones where buying interest could emerge.
Is EEM in a significant dip or a Value Dip right now?
EEM has a Value Score of 89/100. It is currently flagged as a significant dip in the Top Dips list. It is also listed as a Value Dip because long-term sentiment is bullish.
View the full interactive analysis on StockDips.AI.