HPE Weekly Technical Analysis
Hewlett Packard Enterprise
Provides enterprise technology solutions including cloud services, data center servers, storage, and networking hardware.
HPE Technical Analysis Summary
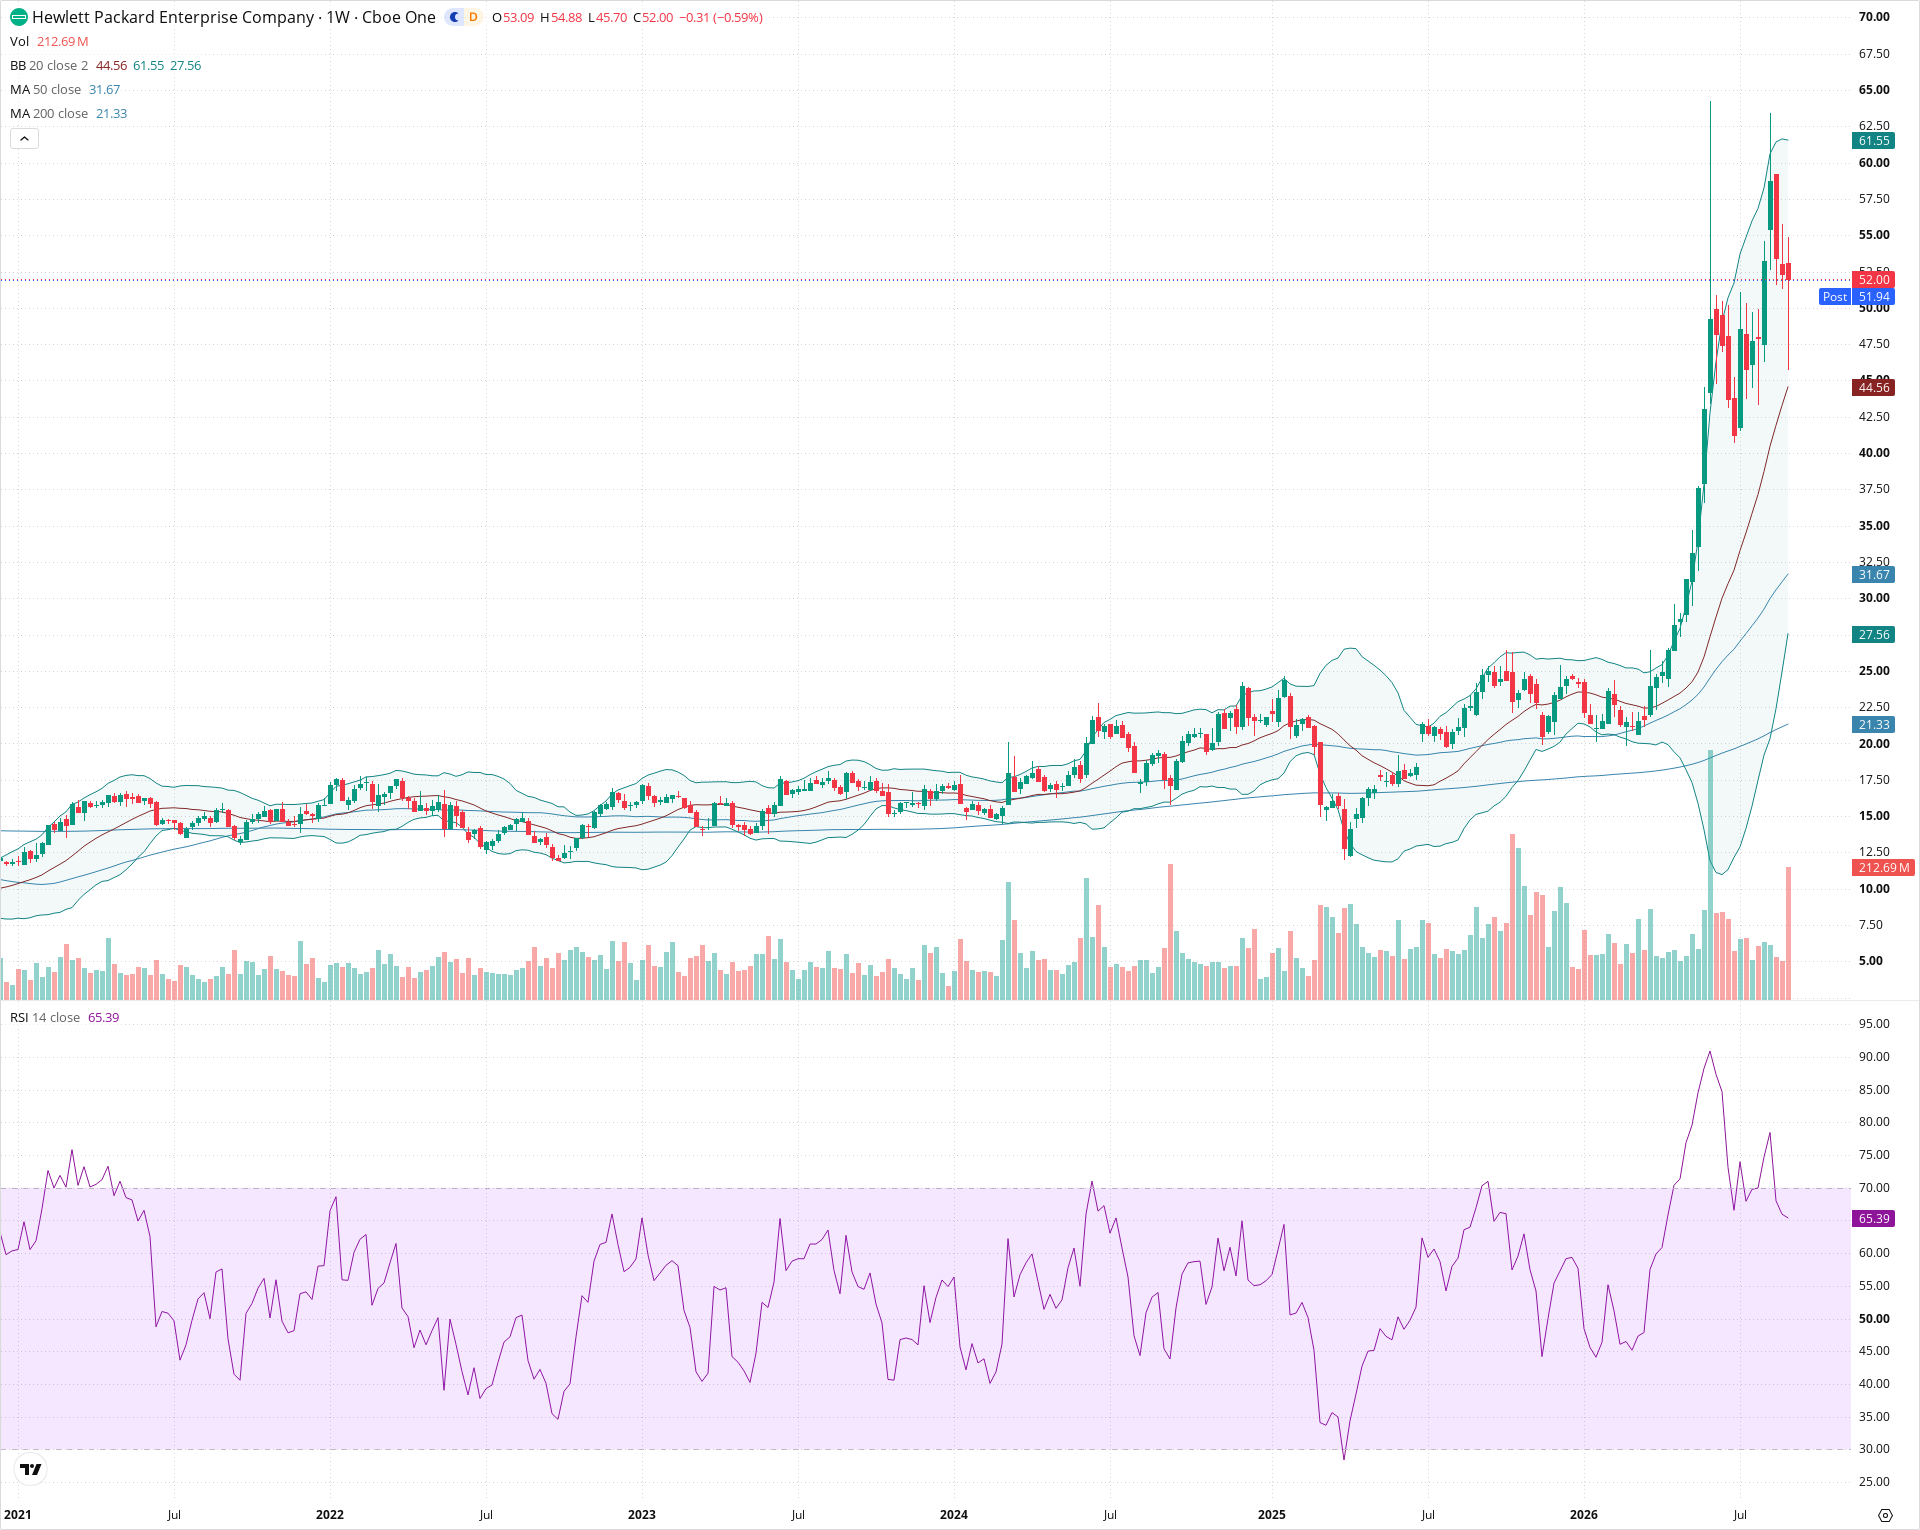
HPE remains in a powerful secular uptrend following a massive multi-year base breakout, supported by a healthy moving average stack (20 > 50 > 200 SMAs). Recent corrective pressure found immediate buyer support at the 20-week SMA near 44.56, creating a decisive long lower wick on high weekly volume. As long as price sustains above the 44.00-46.00 support area, the overarching weekly trend points toward a test of the 62.00-65.00 highs.
Included In Lists
Related Tickers of Interest
HPE Weekly Chart
Sentiment
Short-term Sentiment (days to weeks): Bullish
Price strongly rebounded from a weekly low of 45.70 near the rising 20-week SMA (44.56), leaving a long lower shadow, while RSI holds firmly in bullish territory at 65.39.
Long-term Sentiment (weeks to months): Bullish
Clear bullish moving average alignment with price well above ascending 20-week, 50-week (31.67), and 200-week (21.33) SMAs following an explosive multi-year breakout.
Report Metadata
- Timeframe: weekly
- Generated at: 2026-09-04T21:03:45.880Z
- Model: gemini-3.8-flash
Support Price Levels
| Level | Range | Strength | Notes |
|---|---|---|---|
| $45.00 | $44.00 - $46.00 | Strong | Confluence of the current weekly candle's low (45.70) and the upward-sloping 20-week SMA (44.56). |
| $32.00 | $31.00 - $33.00 | Strong | Intermediate support zone anchored by the rising 50-week SMA. |
| $25.25 | $24.00 - $26.50 | Strong | Major structural breakout level from the prior multi-year consolidation range. |
Resistance Price Levels
| Level | Range | Strength | Notes |
|---|---|---|---|
| $58.75 | $57.50 - $60.00 | Weak | Prior weekly closing resistance cluster below the cycle peak. |
| $63.50 | $62.00 - $65.00 | Strong | Recent multi-year high wick peak aligned closely with the upper Bollinger Band (61.55). |
Potential Chart Patterns in Formation
| Strength | Pattern | Signal | Target | Details |
|---|---|---|---|---|
| Strong | Multi-Year Base Breakout | Bullish | $65.00 | Explosive continuation following an extended consolidation base between 12.50 and 25.00 that resolved upward with heavy volume expansion. |
| Strong | Bullish Hammer / Pin Bar | Bullish | $62.00 | Current weekly candle shows buyers vigorously defending the 20-week SMA, forming a long lower tail and rejecting deeper correction. |
Frequently Asked Questions about HPE
What is the current sentiment for HPE?
The short-term sentiment for HPE is currently Bullish because Price strongly rebounded from a weekly low of 45.70 near the rising 20-week SMA (44.56), leaving a long lower shadow, while RSI holds firmly in bullish territory at 65.39.. The long-term trend is classified as Bullish.
What are the key support levels for HPE?
StockDips.AI has identified key support levels for HPE at $45.00 and $32.00. These levels may represent potential accumulation zones where buying interest could emerge.
Is HPE in a significant dip or a Value Dip right now?
HPE has a Value Score of 79/100. It is currently flagged as a significant dip in the Top Dips list. It is also listed as a Value Dip because long-term sentiment is bullish.
View the full interactive analysis on StockDips.AI.