IBRX Weekly Technical Analysis
Immunitybio Inc
Commercial-stage biotechnology company that develops next-generation therapies designed to bolster the natural immune system to defeat cancers and infectious diseases.
IBRX Technical Analysis Summary
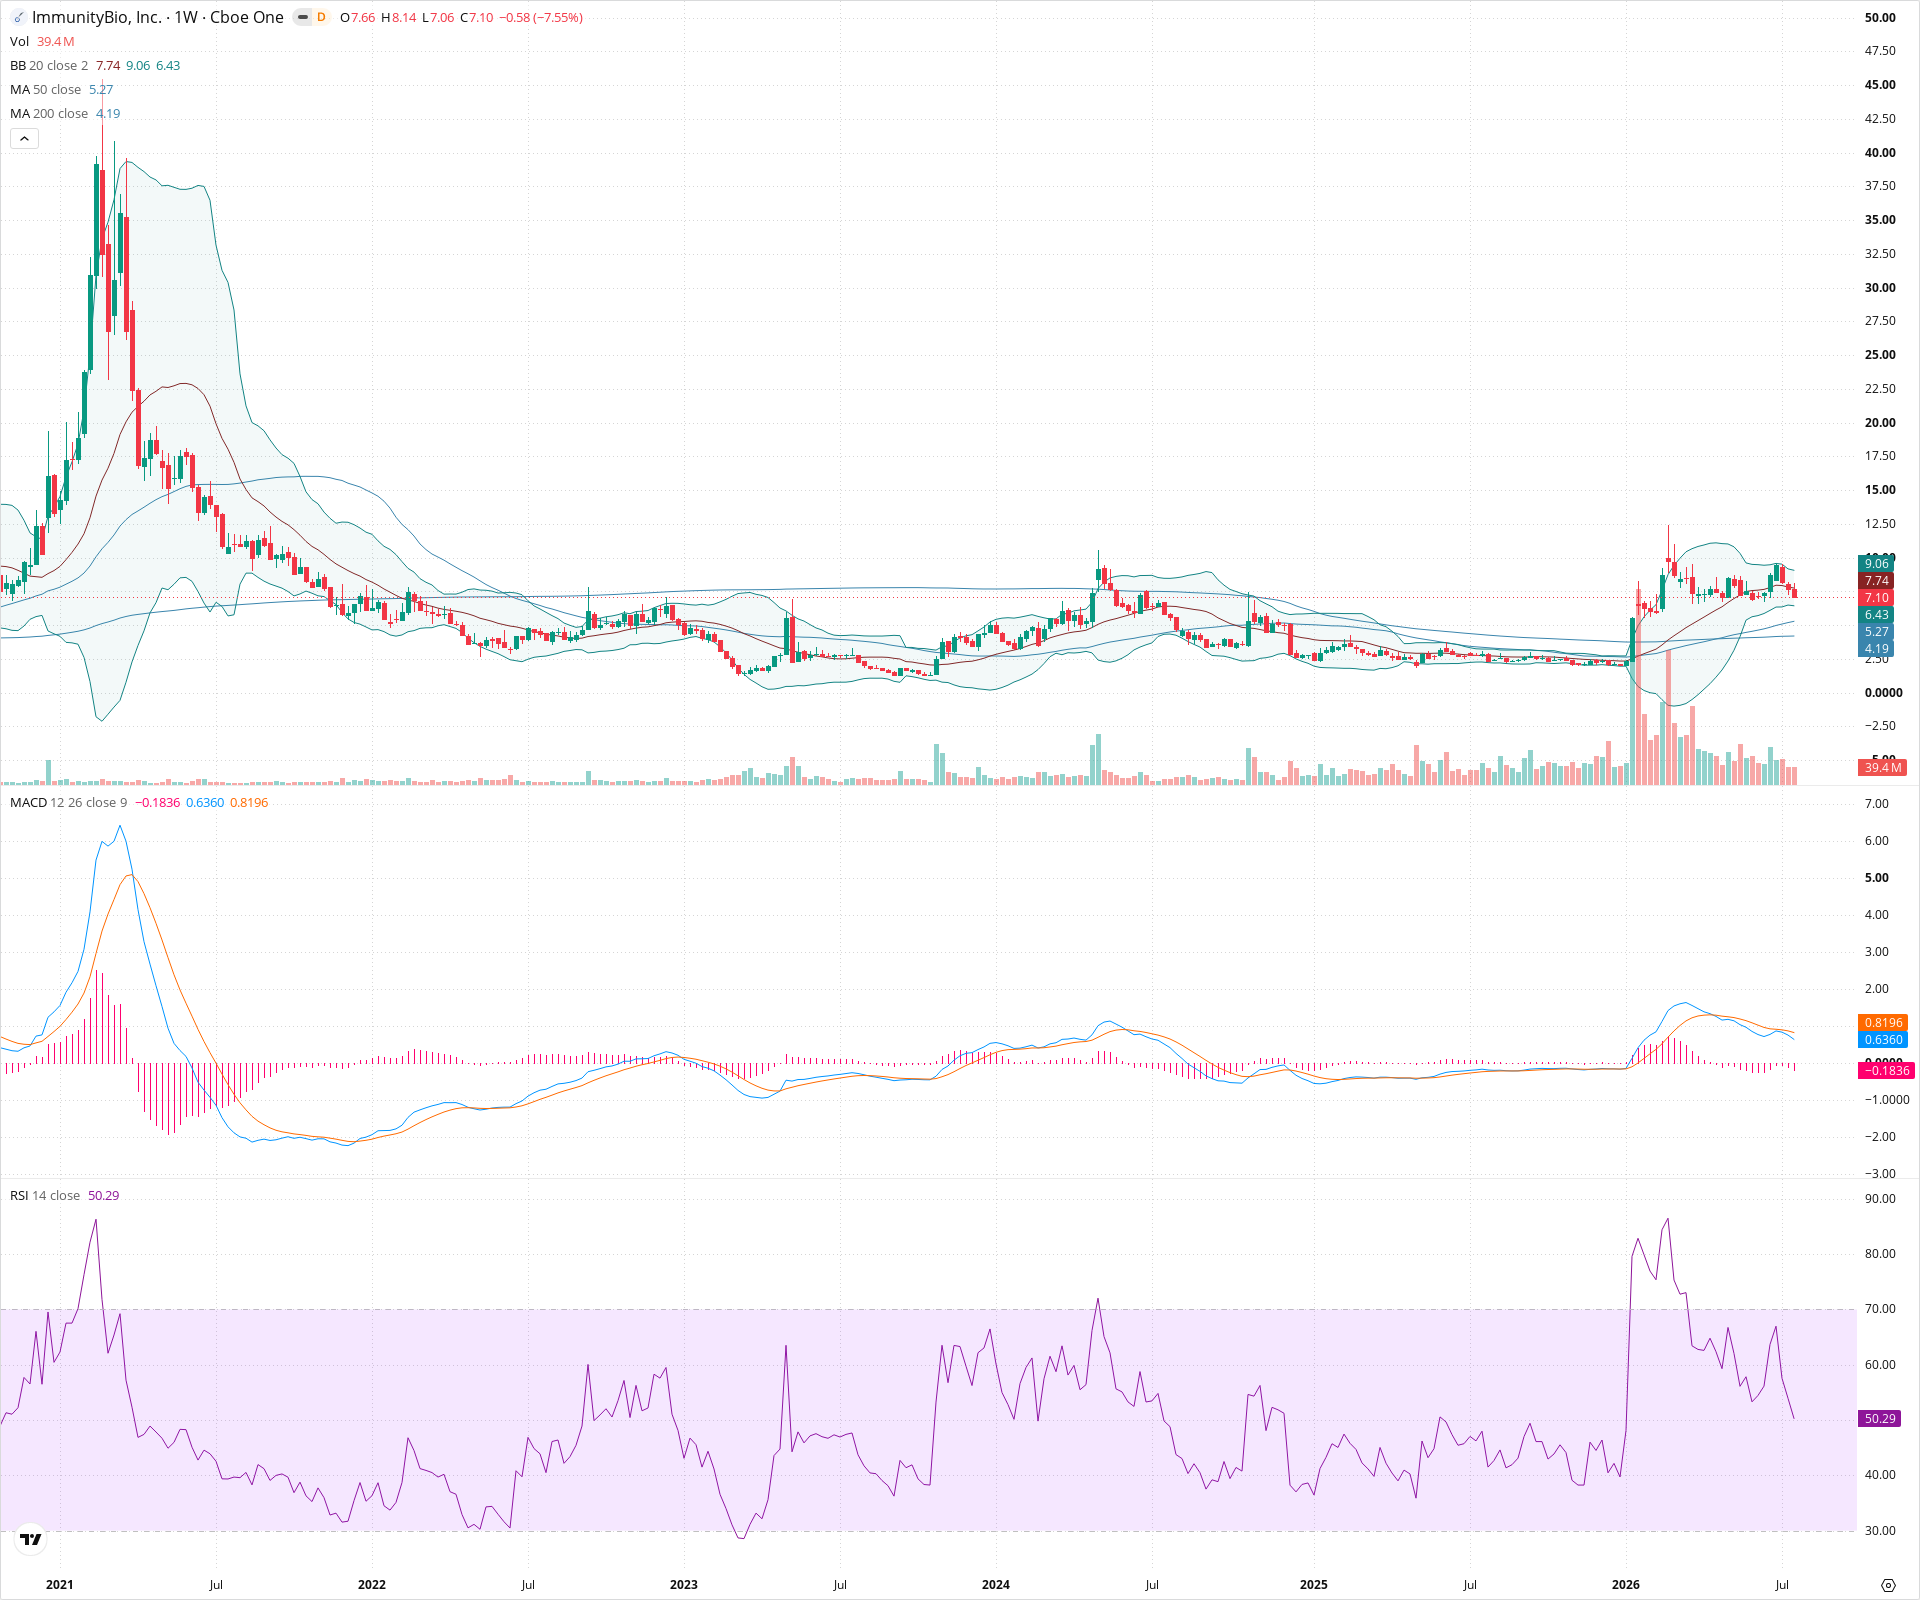
IBRX remains in a long-term bullish posture after a massive, high-volume breakout established a new trend regime, highlighted by a forming weekly Golden Cross. However, the short-term technical picture is currently bearish as the stock digests the huge move, breaking below the 20-week SMA with negative MACD momentum. Long-term investors will want to see the stock find solid footing around the rising 50-week SMA ($5.27 area) to maintain structural integrity.
Included In Lists
Related Tickers of Interest
IBRX Weekly Chart
Sentiment
Short-term Sentiment (days to weeks): Bearish
Price has closed below the 20-week SMA, with the MACD line crossing below the signal line and generating negative histogram bars. RSI is trending downwards towards 50.
Long-term Sentiment (weeks to months): Bullish
The stock is trading well above its 50-week and 200-week SMAs following a massive volume breakout. A weekly Golden Cross (50 SMA crossing above 200 SMA) is currently forming.
Report Metadata
- Timeframe: weekly
- Generated at: 2026-07-25T09:08:45.598Z
- Model: gemini-3.1-pro-preview
Support Price Levels
| Level | Range | Strength | Notes |
|---|---|---|---|
| $5.25 | $5.00 - $5.50 | Strong | Confluence of the rising 50-week SMA and the lower bound of recent multi-week consolidation. |
| $4.25 | $4.00 - $4.50 | Strong | Major structural base prior to the breakout, aligning closely with the 200-week SMA. |
Resistance Price Levels
| Level | Range | Strength | Notes |
|---|---|---|---|
| $9.25 | $9.00 - $9.50 | Strong | Recent local highs and upper bound of the current consolidation range. |
| $12.25 | $12.00 - $12.50 | Strong | The peak of the massive price spike; represents significant overhead supply. |
Potential Chart Patterns in Formation
| Strength | Pattern | Signal | Target | Details |
|---|---|---|---|---|
| Strong | Golden Cross | Bullish | N/A | The 50-week SMA is crossing above the 200-week SMA. |
| Weak | Consolidation / Pullback | Neutral | N/A | A wide, volatile sideways-to-downward digestion period following a massive gap-up and volume surge. |
Frequently Asked Questions about IBRX
What is the current sentiment for IBRX?
The short-term sentiment for IBRX is currently Bearish because Price has closed below the 20-week SMA, with the MACD line crossing below the signal line and generating negative histogram bars. RSI is trending downwards towards 50.. The long-term trend is classified as Bullish.
What are the key support levels for IBRX?
StockDips.AI has identified key support levels for IBRX at $5.25 and $4.25. These levels may represent potential accumulation zones where buying interest could emerge.
Is IBRX in a significant dip or a Value Dip right now?
IBRX has a Value Score of 83/100. It is currently flagged as a significant dip in the Top Dips list. It is also listed as a Value Dip because long-term sentiment is bullish.
View the full interactive analysis on StockDips.AI.