IBRX Monthly Technical Analysis
Immunitybio Inc
Commercial-stage biotechnology company that develops next-generation therapies designed to bolster the natural immune system to defeat cancers and infectious diseases.
IBRX Technical Analysis Summary
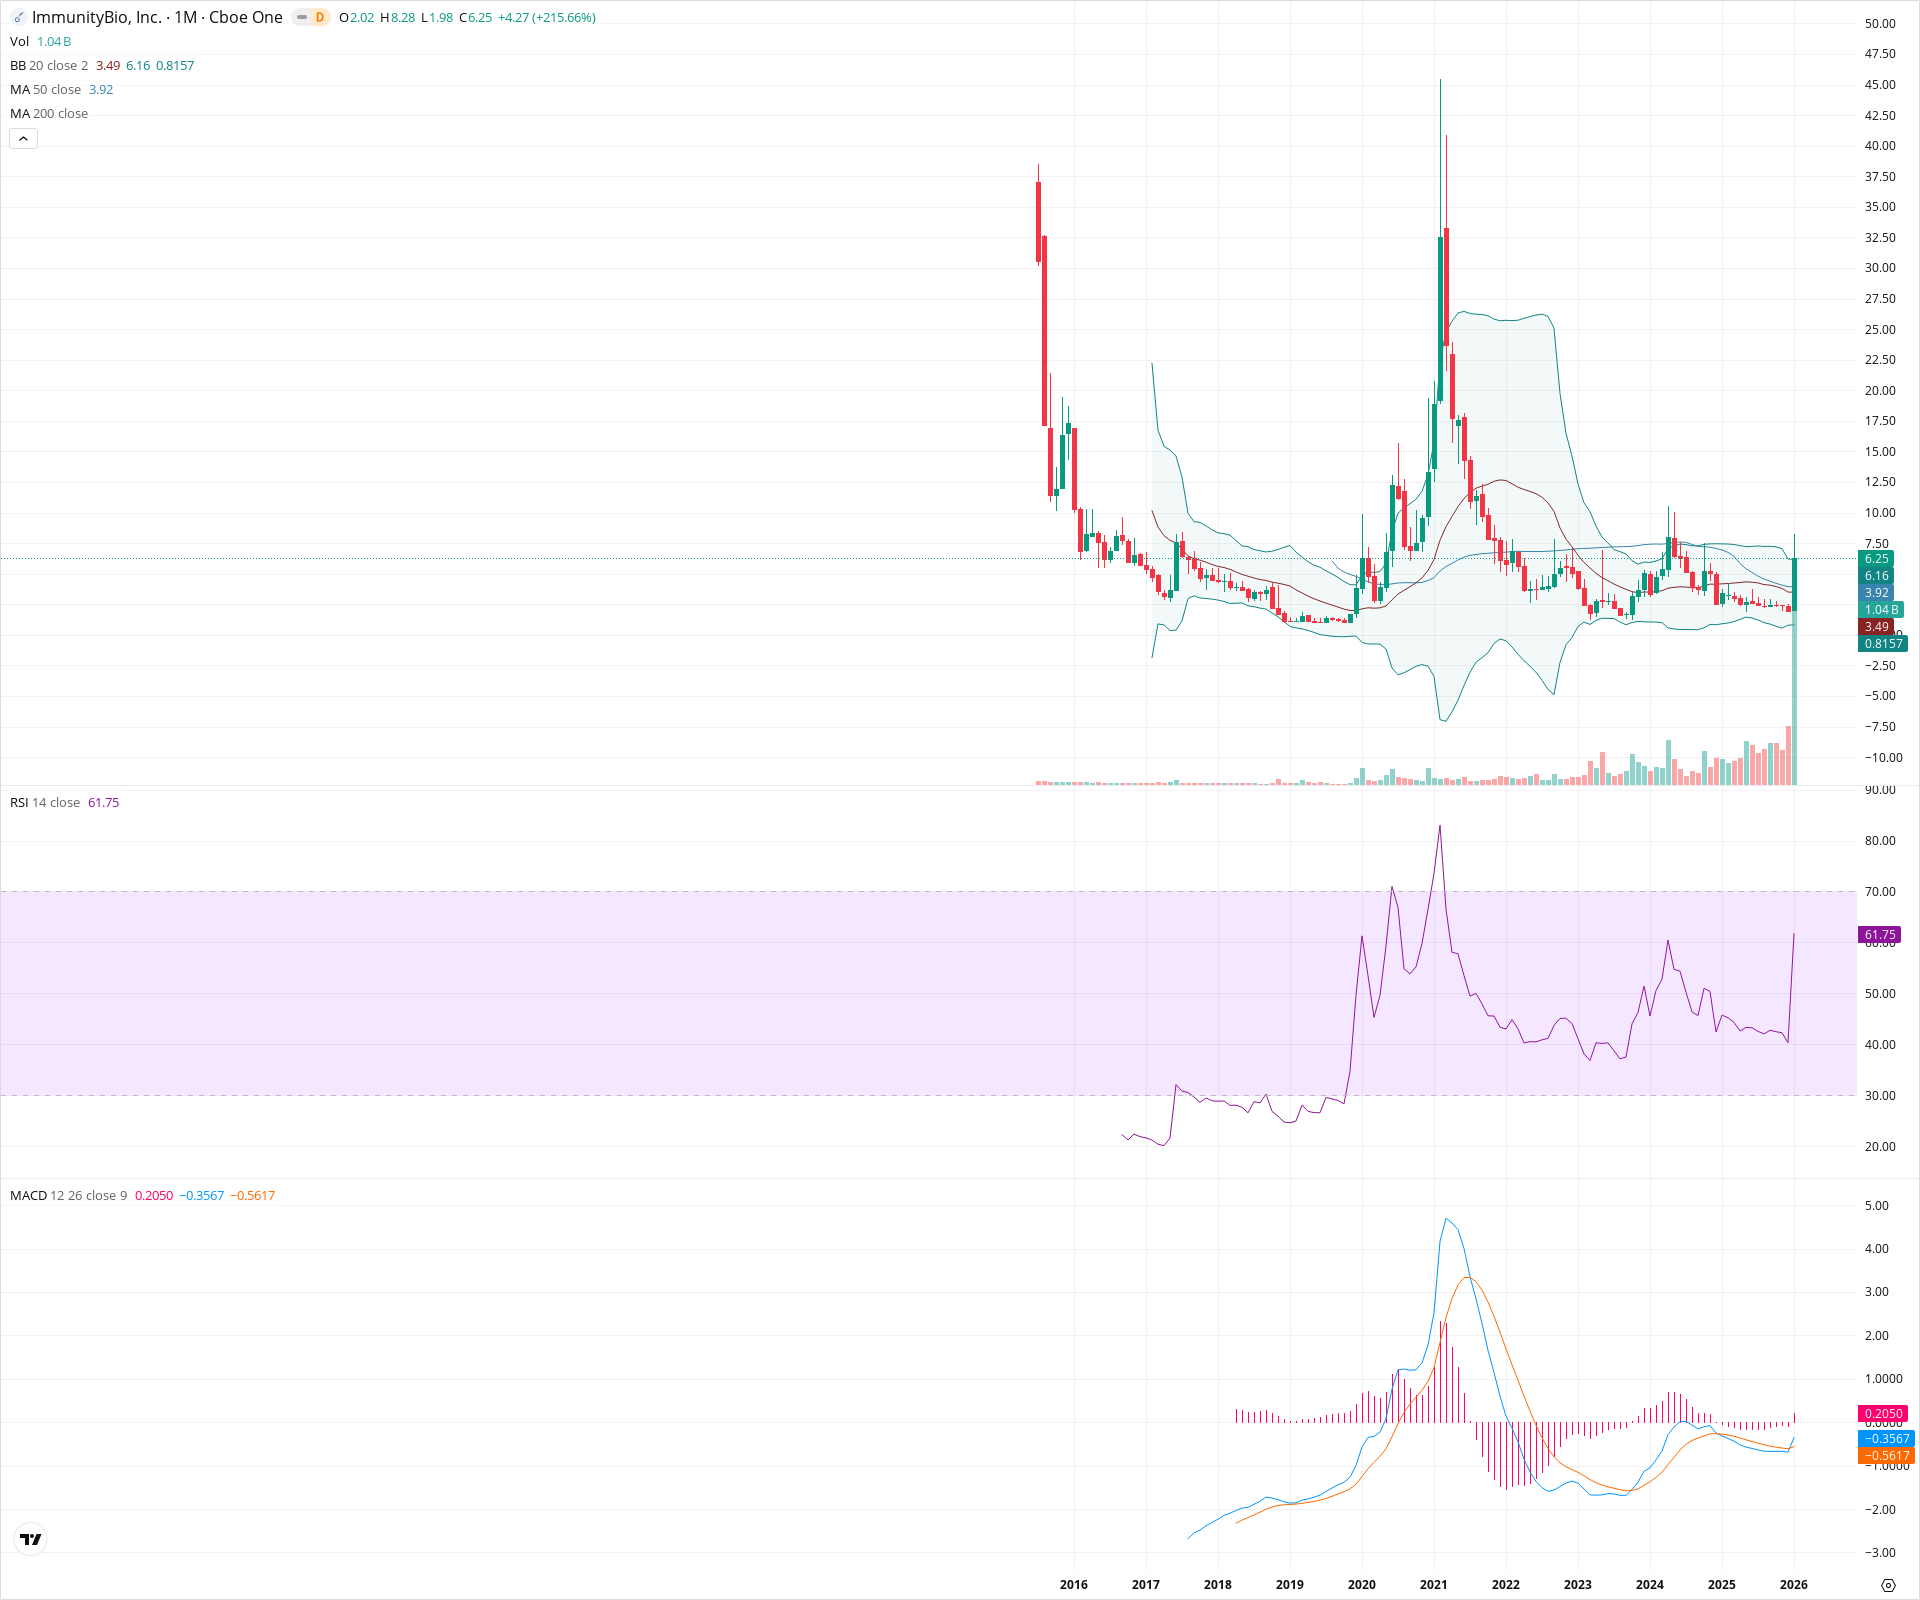
IBRX is undergoing a massive volatility breakout, clearing key long-term moving averages (50 SMA) and emerging from a prolonged multi-year accumulation phase. Momentum indicators are confirming this shift, with the MACD posting a bullish crossover and RSI rising to levels supportive of a new uptrend. While the current monthly move is extended, the technical structure suggests a potential long-term trend reversal is underway.
Included In Lists
Related Tickers of Interest
IBRX Monthly Chart
Sentiment
Short-term Sentiment (days to weeks): Bullish
Price has exploded upwards with a +215% candle this month, breaking decisively above the 20-month and 50-month SMAs and closing outside the Upper Bollinger Band.
Long-term Sentiment (weeks to months): Bullish
A significant structural shift is occurring as price exits a multi-year base. The monthly MACD has crossed bullishly, and the RSI has pushed above 60 into bullish territory for the first time since the 2021 peak.
Report Metadata
- Timeframe: monthly
- Generated at: 2026-02-02T06:24:25.614Z
- Model: gemini-3-pro-preview
Support Price Levels
| Level | Range | Strength | Notes |
|---|---|---|---|
| $3.71 | $3.49 - $3.92 | Strong | Confluence of the 20-month SMA (3.49) and 50-month SMA (3.92), representing the top of the previous base. |
| $2.09 | $1.98 - $2.20 | Strong | Low of the current breakout candle and the floor of the multi-year consolidation zone. |
Resistance Price Levels
| Level | Range | Strength | Notes |
|---|---|---|---|
| $8.14 | $8.00 - $8.28 | Weak | Immediate resistance at the current monthly high (8.28) and prior local peaks from late 2023. |
| $10.25 | $9.50 - $11.00 | Strong | Historical congestion zone from 2019-2020 and interim highs before the major 2021 crash. |
Potential Chart Patterns in Formation
| Strength | Pattern | Signal | Target | Details |
|---|---|---|---|---|
| Strong | Multi-Year Base Breakout | Bullish | $10.00 | After consolidating between approx. $1.00 and $4.00 since 2022, price has impulsively broken out to the upside on high volume. |
Frequently Asked Questions about IBRX
What is the current sentiment for IBRX?
The short-term sentiment for IBRX is currently Bullish because Price has exploded upwards with a +215% candle this month, breaking decisively above the 20-month and 50-month SMAs and closing outside the Upper Bollinger Band.. The long-term trend is classified as Bullish.
What are the key support levels for IBRX?
StockDips.AI has identified key support levels for IBRX at $3.71 and $2.09. These levels may represent potential accumulation zones where buying interest could emerge.
Is IBRX in a significant dip or a Value Dip right now?
IBRX has a Value Score of 83/100. It is currently flagged as a significant dip in the Top Dips list. It is also listed as a Value Dip because long-term sentiment is bullish.
View the full interactive analysis on StockDips.AI.