IJH Weekly Technical Analysis
US Mid Cap Index (400)
iShares Core S&P Mid-Cap ETF - Provides exposure to mid-sized U.S. companies in the S&P MidCap 400 index.
IJH Technical Analysis Summary
The long-term technical picture for IJH remains firmly bullish, evidenced by a sustained structural uptrend and price trading well above rising key moving averages. In the short term, upside momentum is pausing as price digests recent gains and consolidates near new highs. A period of sideways trading or a shallow pullback to test support near the 20-week SMA would be constructive before a potential continuation of the broader uptrend.
Included In Lists
Related Tickers of Interest
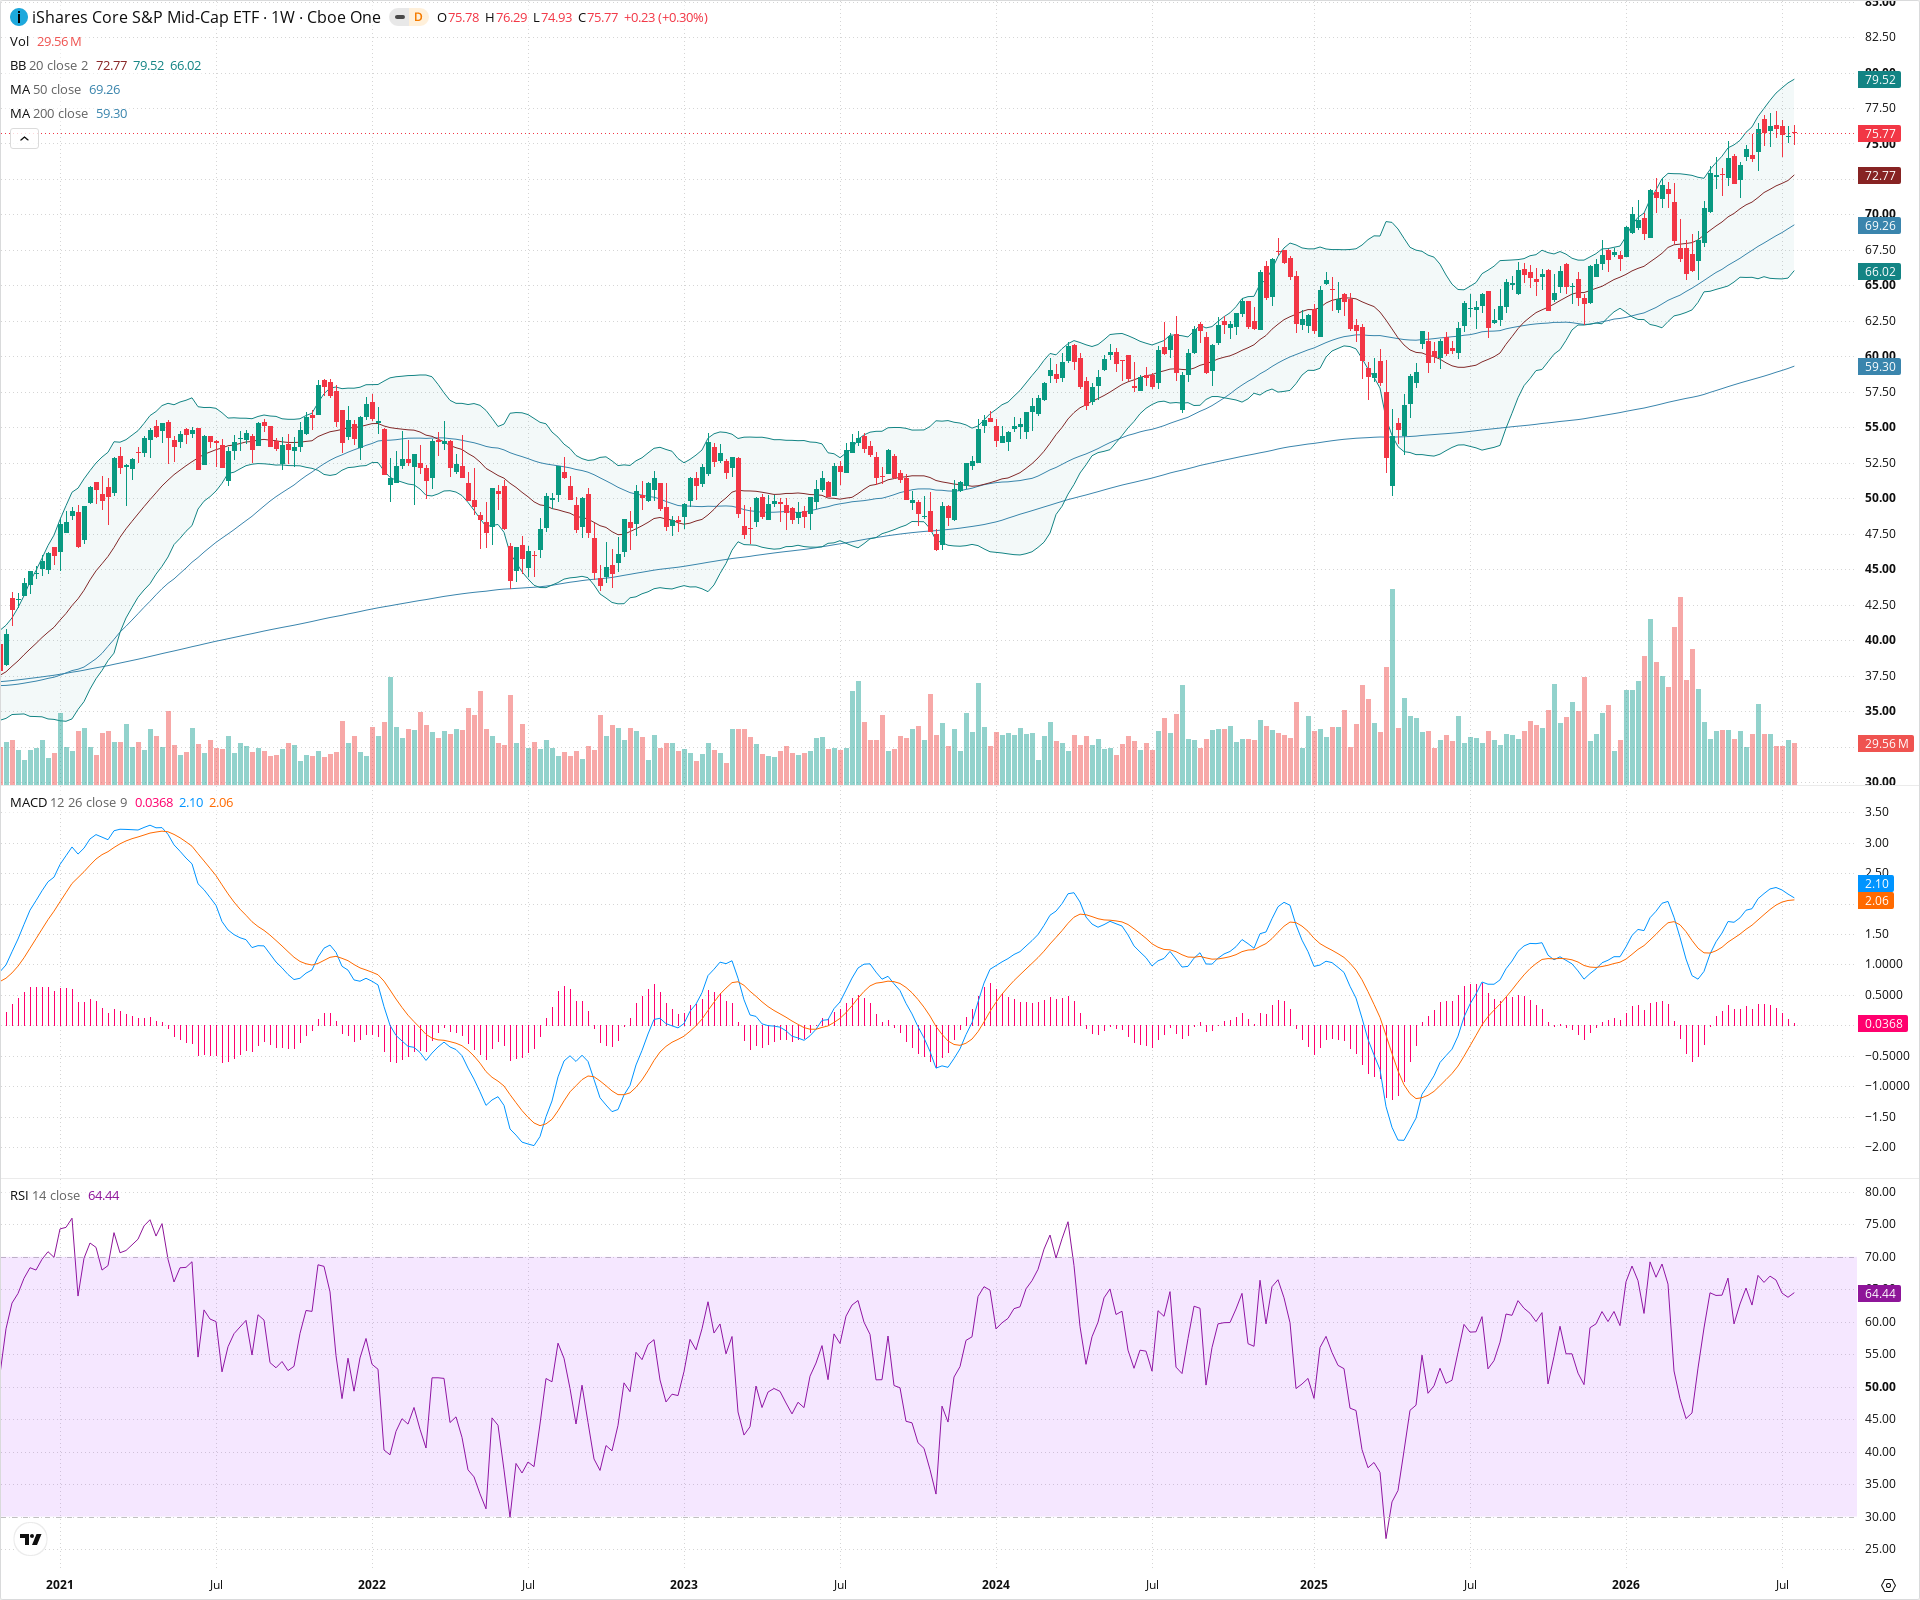
IJH Weekly Chart
Sentiment
Short-term Sentiment (days to weeks): Neutral
Price is consolidating near recent highs with small-bodied candles over the last few weeks. The MACD histogram is contracting and RSI is sloping downwards from near-overbought levels, indicating a pause in short-term bullish momentum.
Long-term Sentiment (weeks to months): Bullish
The chart displays a strong, multi-year structural uptrend with a clear sequence of higher highs and higher lows. Price remains comfortably above the upward-sloping 50-week and 200-week SMAs, which are in a bullish alignment.
Report Metadata
- Timeframe: weekly
- Generated at: 2026-07-25T09:01:52.499Z
- Model: gemini-3.1-pro-preview
Support Price Levels
| Level | Range | Strength | Notes |
|---|---|---|---|
| $73.00 | $72.50 - $73.50 | Strong | Confluence of recent breakout levels, previous swing highs, and the rising 20-week SMA (middle Bollinger Band). |
| $69.00 | $68.00 - $70.00 | Strong | Major structural support zone aligning with the rising 50-week SMA and a significant previous consolidation area. |
| $64.75 | $64.00 - $65.50 | Strong | Significant prior swing low and an area of strong historical demand where a multi-month consolidation occurred. |
Resistance Price Levels
| Level | Range | Strength | Notes |
|---|---|---|---|
| $77.00 | $76.50 - $77.50 | Weak | Current visible peak zone; immediate overhead resistance representing the recent high-water mark. |
Potential Chart Patterns in Formation
| Strength | Pattern | Signal | Target | Details |
|---|---|---|---|---|
| Strong | Ascending Channel | Bullish | N/A | A broad, multi-year pattern of higher highs and higher lows defining the primary uptrend trajectory. |
| Weak | Bull Flag (Forming) | Bullish | N/A | Price is currently moving sideways in a tight range following a steep rally, potentially building a continuation pattern. |
Frequently Asked Questions about IJH
What is the current sentiment for IJH?
The short-term sentiment for IJH is currently Neutral because Price is consolidating near recent highs with small-bodied candles over the last few weeks. The MACD histogram is contracting and RSI is sloping downwards from near-overbought levels, indicating a pause in short-term bullish momentum.. The long-term trend is classified as Bullish.
What are the key support levels for IJH?
StockDips.AI has identified key support levels for IJH at $73.00 and $69.00. These levels may represent potential accumulation zones where buying interest could emerge.
Is IJH in a significant dip or a Value Dip right now?
IJH has a Value Score of 55/100. It is not currently flagged as a significant dip in the Top Dips list. It is not listed as a Value Dip because the long-term sentiment or value-score threshold does not qualify.
View the full interactive analysis on StockDips.AI.