IJH Monthly Technical Analysis
US Mid Cap Index (400)
iShares Core S&P Mid-Cap ETF - Provides exposure to mid-sized U.S. companies in the S&P MidCap 400 index.
IJH Technical Analysis Summary
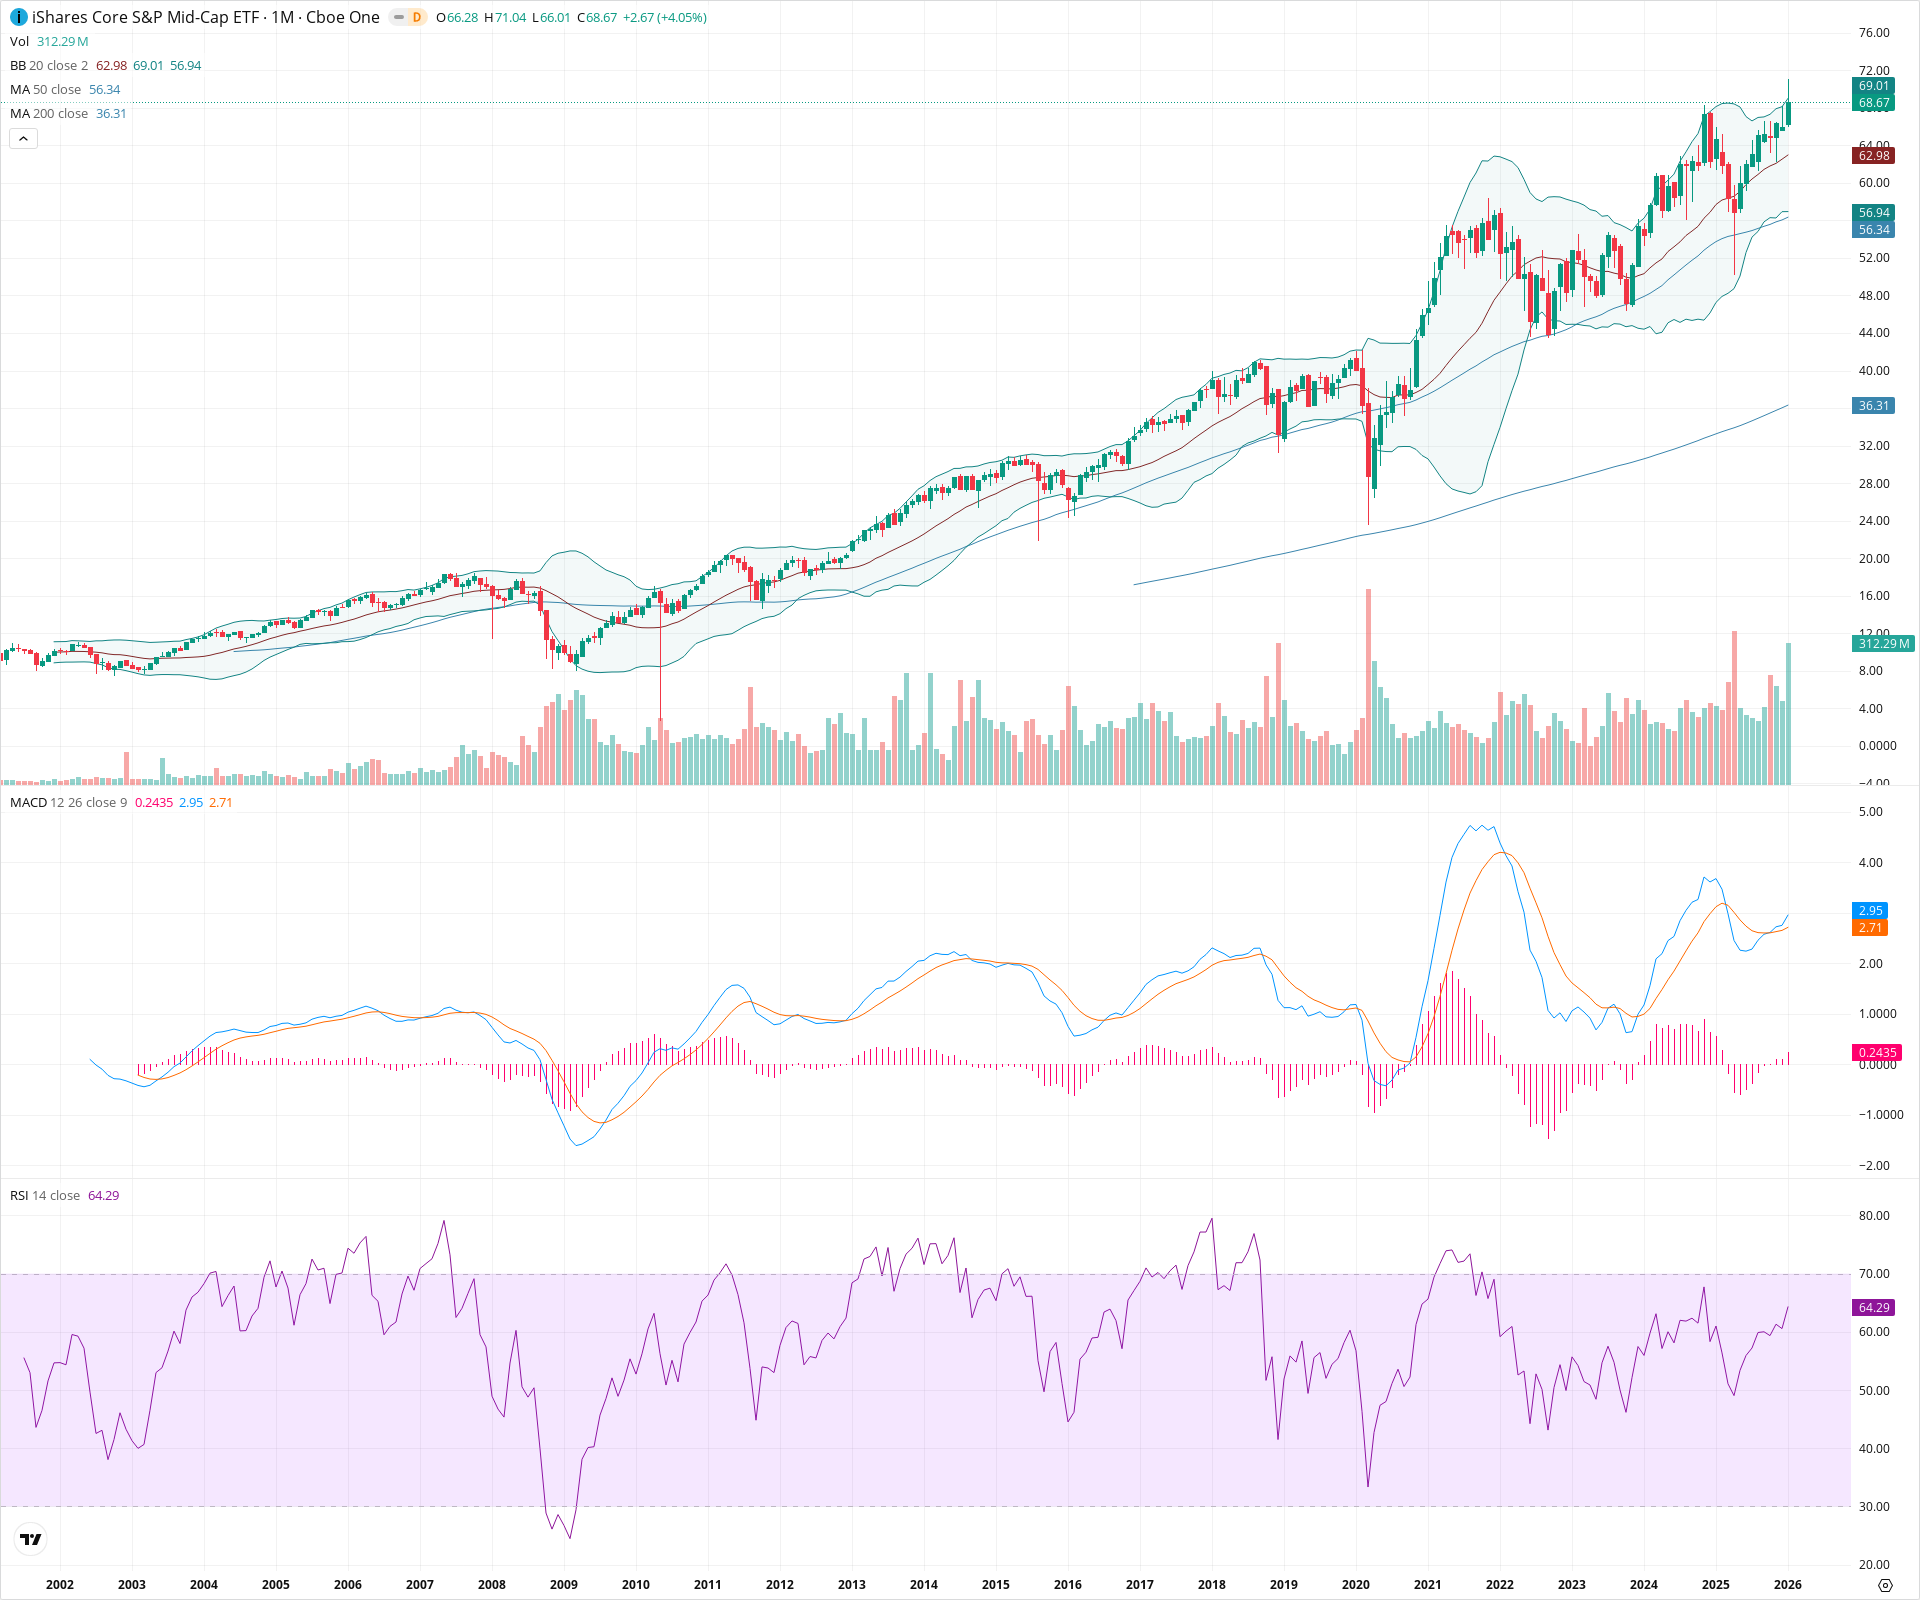
IJH has confirmed a long-term bullish breakout, clearing key structural resistance from 2021 to enter new all-time high territory. Momentum indicators such as the MACD and RSI are supportive of the trend, with the 20-month and 50-month SMAs providing rising floors of support underneath the price action.
Included In Lists
Related Tickers of Interest
IJH Monthly Chart
Sentiment
Short-term Sentiment (days to weeks): Bullish
Price is breaking out to new highs with a strong green candle piercing the upper Bollinger Band. RSI is rising (approx 64) but not yet overbought, indicating strong momentum without immediate exhaustion.
Long-term Sentiment (weeks to months): Bullish
The chart displays a robust secular uptrend with a bullish alignment of moving averages (20 > 50 > 200). A multi-year consolidation phase (2021–2023) has successfully resolved to the upside, confirming trend continuation.
Report Metadata
- Timeframe: monthly
- Generated at: 2026-02-02T04:03:48.111Z
- Model: gemini-3-pro-preview
Support Price Levels
| Level | Range | Strength | Notes |
|---|---|---|---|
| $63.00 | $62.50 - $63.50 | Strong | Confluence of the 20-month SMA and the Bollinger Band basis line. |
| $57.00 | $56.00 - $58.00 | Strong | Major structural support zone comprising the 2021 breakout level and the 50-month SMA. |
| $47.00 | $46.00 - $48.00 | Weak | Significant swing lows established during the 2022 market correction. |
Resistance Price Levels
| Level | Range | Strength | Notes |
|---|---|---|---|
| $71.02 | $71.00 - $71.04 | Weak | Current monthly high acts as immediate resistance in blue-sky territory. |
Potential Chart Patterns in Formation
| Strength | Pattern | Signal | Target | Details |
|---|---|---|---|---|
| Strong | Secular Breakout | Bullish | N/A | Price has decisively cleared the multi-year resistance range (approx 57-58) established in 2021/2022, entering a price discovery phase. |
Frequently Asked Questions about IJH
What is the current sentiment for IJH?
The short-term sentiment for IJH is currently Bullish because Price is breaking out to new highs with a strong green candle piercing the upper Bollinger Band. RSI is rising (approx 64) but not yet overbought, indicating strong momentum without immediate exhaustion.. The long-term trend is classified as Bullish.
What are the key support levels for IJH?
StockDips.AI has identified key support levels for IJH at $63.00 and $57.00. These levels may represent potential accumulation zones where buying interest could emerge.
Is IJH in a significant dip or a Value Dip right now?
IJH has a Value Score of 55/100. It is not currently flagged as a significant dip in the Top Dips list. It is not listed as a Value Dip because the long-term sentiment or value-score threshold does not qualify.
View the full interactive analysis on StockDips.AI.