IWM Monthly Technical Analysis
US Small Cap Index (2000)
iShares Russell 2000 ETF - Tracks the index of 2000 small U.S. companies representing the small-cap segment.
IWM Technical Analysis Summary
IWM has definitively broken out of a large three-year consolidation base, clearing previous all-time highs to enter a price discovery phase. The bullish alignment of major moving averages and a rising MACD suggest the resumption of the long-term secular uptrend. Short-term momentum is strong, with the breakout zone around 240 serving as critical support for any pullbacks.
Included In Lists
Related Tickers of Interest
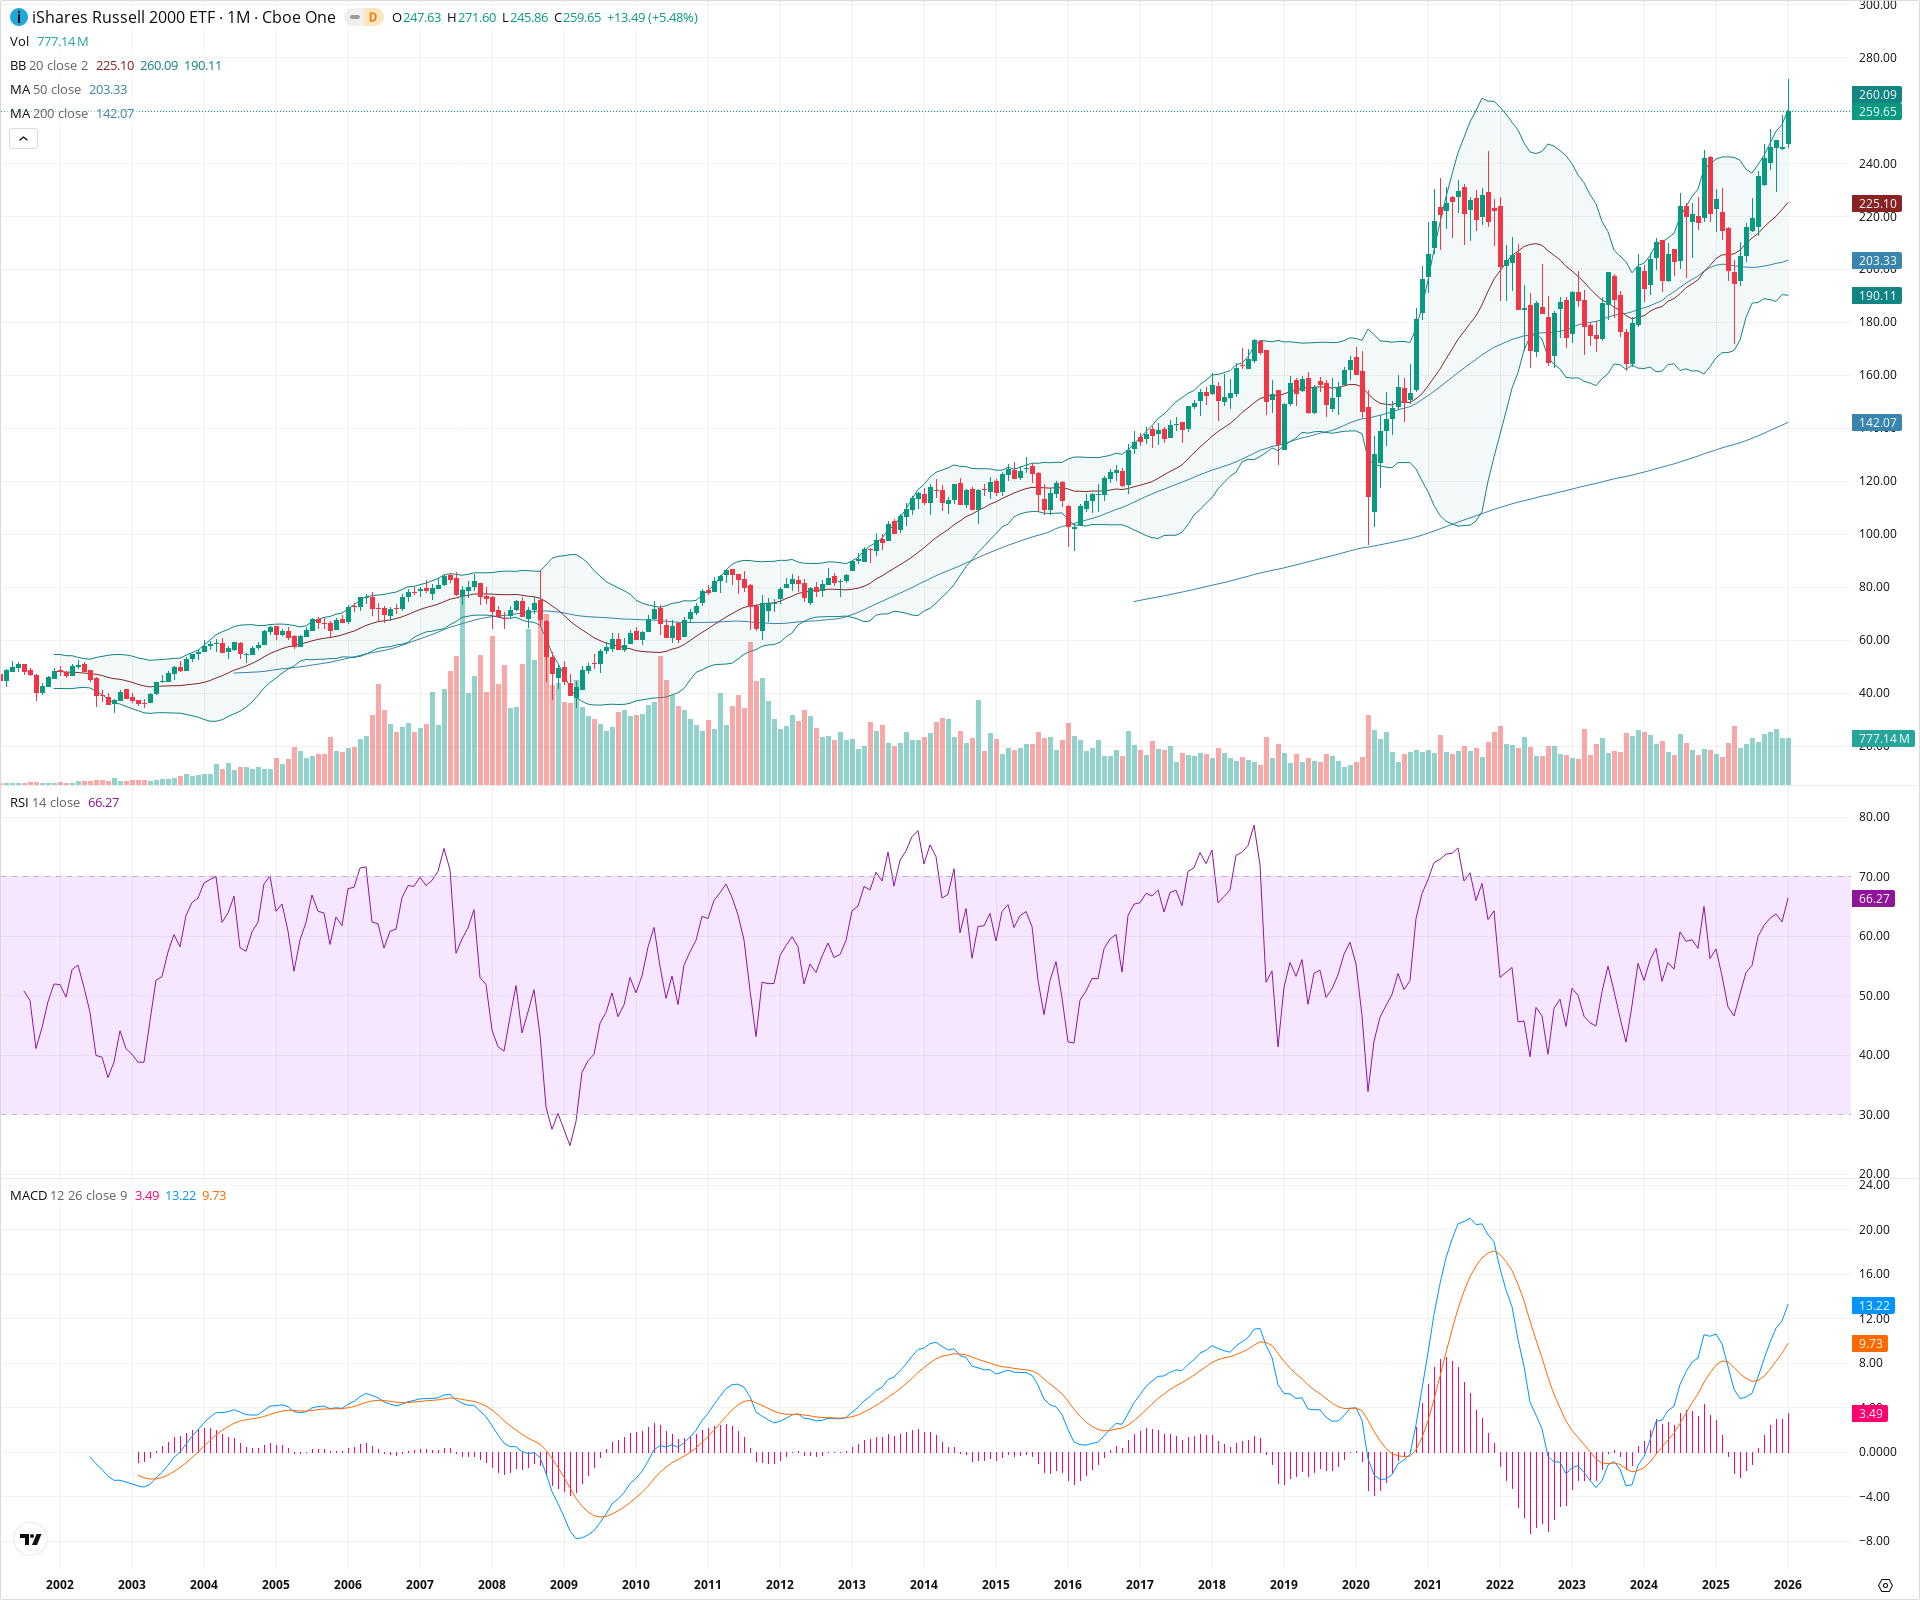
IWM Monthly Chart
Sentiment
Short-term Sentiment (days to weeks): Bullish
Price has recently broken out to new all-time highs with a strong monthly candle. The RSI is rising into bullish territory (66.27) without being excessively overbought, and the MACD histogram is expanding positively, indicating accelerating momentum.
Long-term Sentiment (weeks to months): Bullish
The chart displays a successful breakout from a multi-year consolidation pattern (2022–2024). Moving averages are aligned in a bullish sequence, with price holding above the rising 20 and 50-month SMAs. The MACD has confirmed a bullish crossover above the zero line, signaling a renewed secular uptrend.
Report Metadata
- Timeframe: monthly
- Generated at: 2026-02-02T04:03:31.910Z
- Model: gemini-3-pro-preview
Support Price Levels
| Level | Range | Strength | Notes |
|---|---|---|---|
| $240.00 | $235.00 - $245.00 | Strong | Former major resistance (2021 all-time highs) which should now act as a primary support floor following the breakout. |
| $197.50 | $190.00 - $205.00 | Strong | Confluence of the 50-month SMA and the midline of the previous multi-year trading range. |
| $165.00 | $160.00 - $170.00 | Strong | Major structural low and bottom of the 2022-2023 consolidation phase. |
Resistance Price Levels
| Level | Range | Strength | Notes |
|---|---|---|---|
| $271.80 | $271.60 - $272.00 | Weak | The immediate high of the current monthly candle. |
| $300.00 | $300.00 - $300.00 | Weak | Psychological round number target as price is in price discovery mode above all-time highs. |
Potential Chart Patterns in Formation
| Strength | Pattern | Signal | Target | Details |
|---|---|---|---|---|
| Strong | Multi-Year Range Breakout | Bullish | $325.00 | Price consolidated between ~165 and ~245 from early 2022 through late 2024. The recent push above 245 confirms a resolution to the upside. |
Frequently Asked Questions about IWM
What is the current sentiment for IWM?
The short-term sentiment for IWM is currently Bullish because Price has recently broken out to new all-time highs with a strong monthly candle. The RSI is rising into bullish territory (66.27) without being excessively overbought, and the MACD histogram is expanding positively, indicating accelerating momentum.. The long-term trend is classified as Bullish.
What are the key support levels for IWM?
StockDips.AI has identified key support levels for IWM at $240.00 and $197.50. These levels may represent potential accumulation zones where buying interest could emerge.
Is IWM in a significant dip or a Value Dip right now?
IWM has a Value Score of 96/100. It is currently flagged as a significant dip in the Top Dips list. It is also listed as a Value Dip because long-term sentiment is bullish.
View the full interactive analysis on StockDips.AI.