JNJ Monthly Technical Analysis
Johnson & Johnson
Global healthcare giant in pharma, medical devices, and consumer health
JNJ Technical Analysis Summary
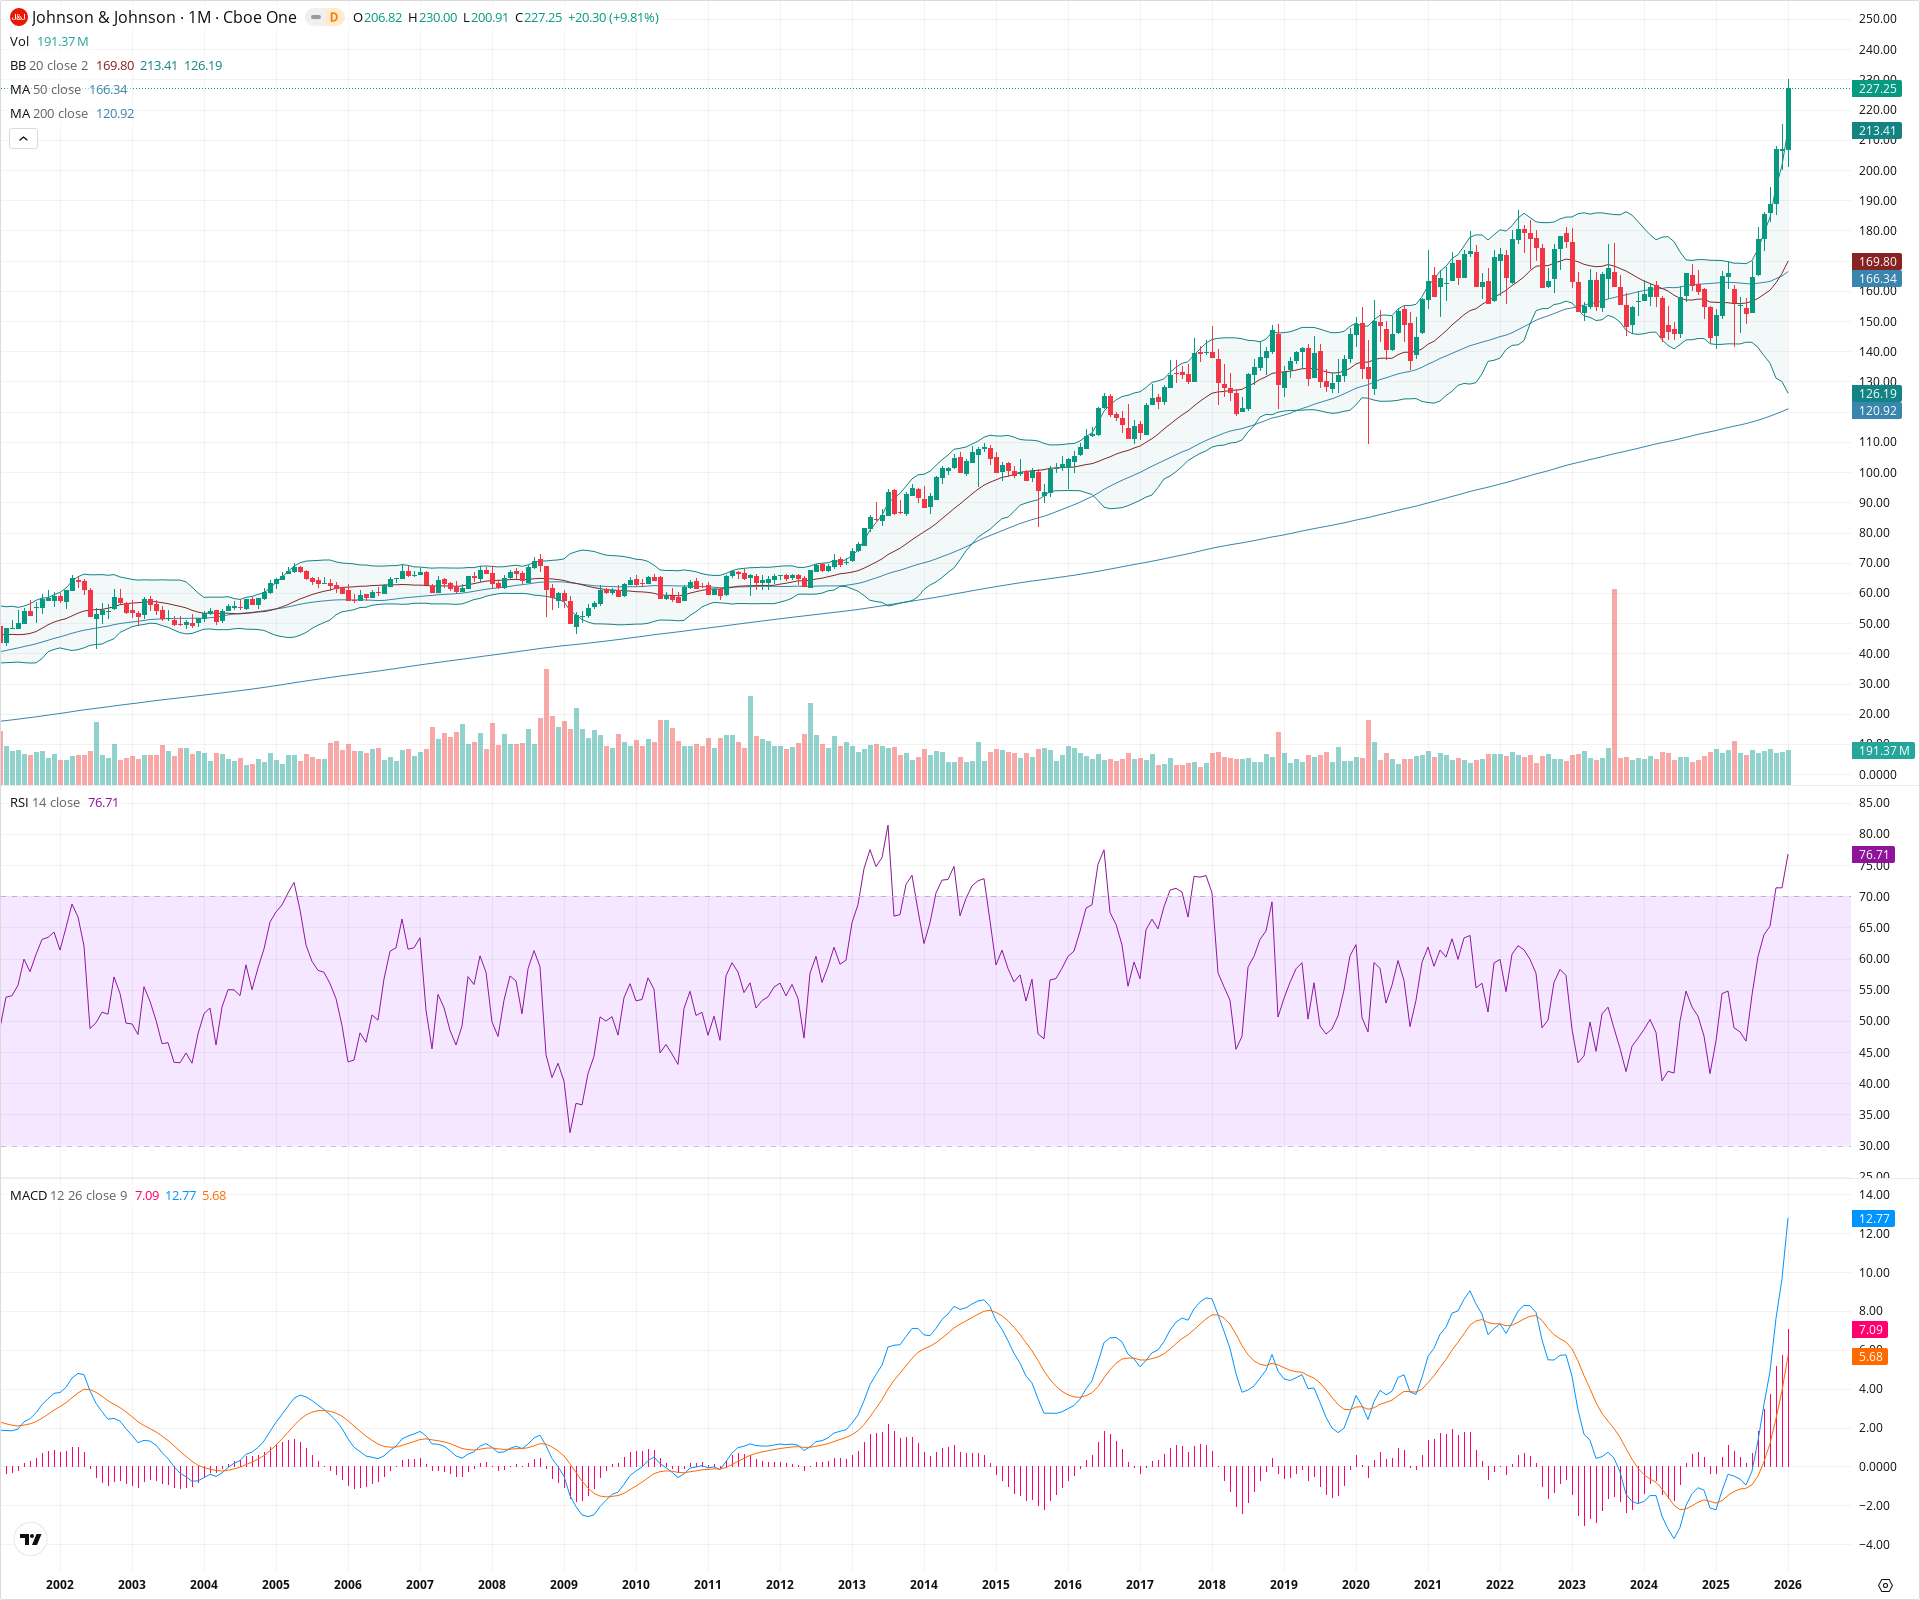
JNJ has entered a powerful discovery phase after shattering a multi-year resistance ceiling around 186. The breakout is supported by expanding volume and a bullish MACD crossover, with price riding the upper Bollinger Band in a high-momentum regime. While the RSI is elevated, the alignment of moving averages and the magnitude of the breakout suggest the long-term uptrend has resumed with vigor.
Included In Lists
Related Tickers of Interest
JNJ Monthly Chart
Sentiment
Short-term Sentiment (days to weeks): Bullish
The price has printed a massive bullish candle, breaking out to new all-time highs and closing significantly above the upper Bollinger Band. RSI is above 70, indicating strong momentum rather than exhaustion in this breakout phase.
Long-term Sentiment (weeks to months): Bullish
The stock is in a confirmed secular uptrend, trading well above both the rising 50-month and 200-month SMAs. The recent breakout from a multi-year consolidation range (2021-2024) signals a continuation of the long-term primary trend.
Report Metadata
- Timeframe: monthly
- Generated at: 2026-02-02T06:25:23.914Z
- Model: gemini-3-pro-preview
Support Price Levels
| Level | Range | Strength | Notes |
|---|---|---|---|
| $180.50 | $175.00 - $186.00 | Strong | Former multi-year resistance zone (2022 highs) that should now act as major structural support after the breakout. |
| $163.00 | $160.00 - $166.00 | Strong | Confluence of the 50-month SMA and the midpoint of the prior consolidation range. |
| $147.50 | $145.00 - $150.00 | Strong | Major swing lows defining the bottom of the multi-year base structure. |
Resistance Price Levels
| Level | Range | Strength | Notes |
|---|---|---|---|
| $230.00 | $230.00 - $230.00 | Weak | Current monthly high and immediate psychological resistance level. |
Potential Chart Patterns in Formation
| Strength | Pattern | Signal | Target | Details |
|---|---|---|---|---|
| Strong | Multi-Year Consolidation Breakout | Bullish | $215.00 | Price has decisively broken out of a long-term rectangular trading range (approx. 150-185) that contained price action for several years. |
Frequently Asked Questions about JNJ
What is the current sentiment for JNJ?
The short-term sentiment for JNJ is currently Bullish because The price has printed a massive bullish candle, breaking out to new all-time highs and closing significantly above the upper Bollinger Band. RSI is above 70, indicating strong momentum rather than exhaustion in this breakout phase.. The long-term trend is classified as Bullish.
What are the key support levels for JNJ?
StockDips.AI has identified key support levels for JNJ at $180.50 and $163.00. These levels may represent potential accumulation zones where buying interest could emerge.
Is JNJ in a significant dip or a Value Dip right now?
JNJ has a Value Score of 21/100. It is not currently flagged as a significant dip in the Top Dips list. It is not listed as a Value Dip because the long-term sentiment or value-score threshold does not qualify.
View the full interactive analysis on StockDips.AI.