KEEL Monthly Technical Analysis
Keel Infrastructure Corp (formerly Bitfarms)
Bitcoin mining, High-Performance Computing (HPC) and Artificial Intelligence (AI) infrastructure
KEEL Technical Analysis Summary
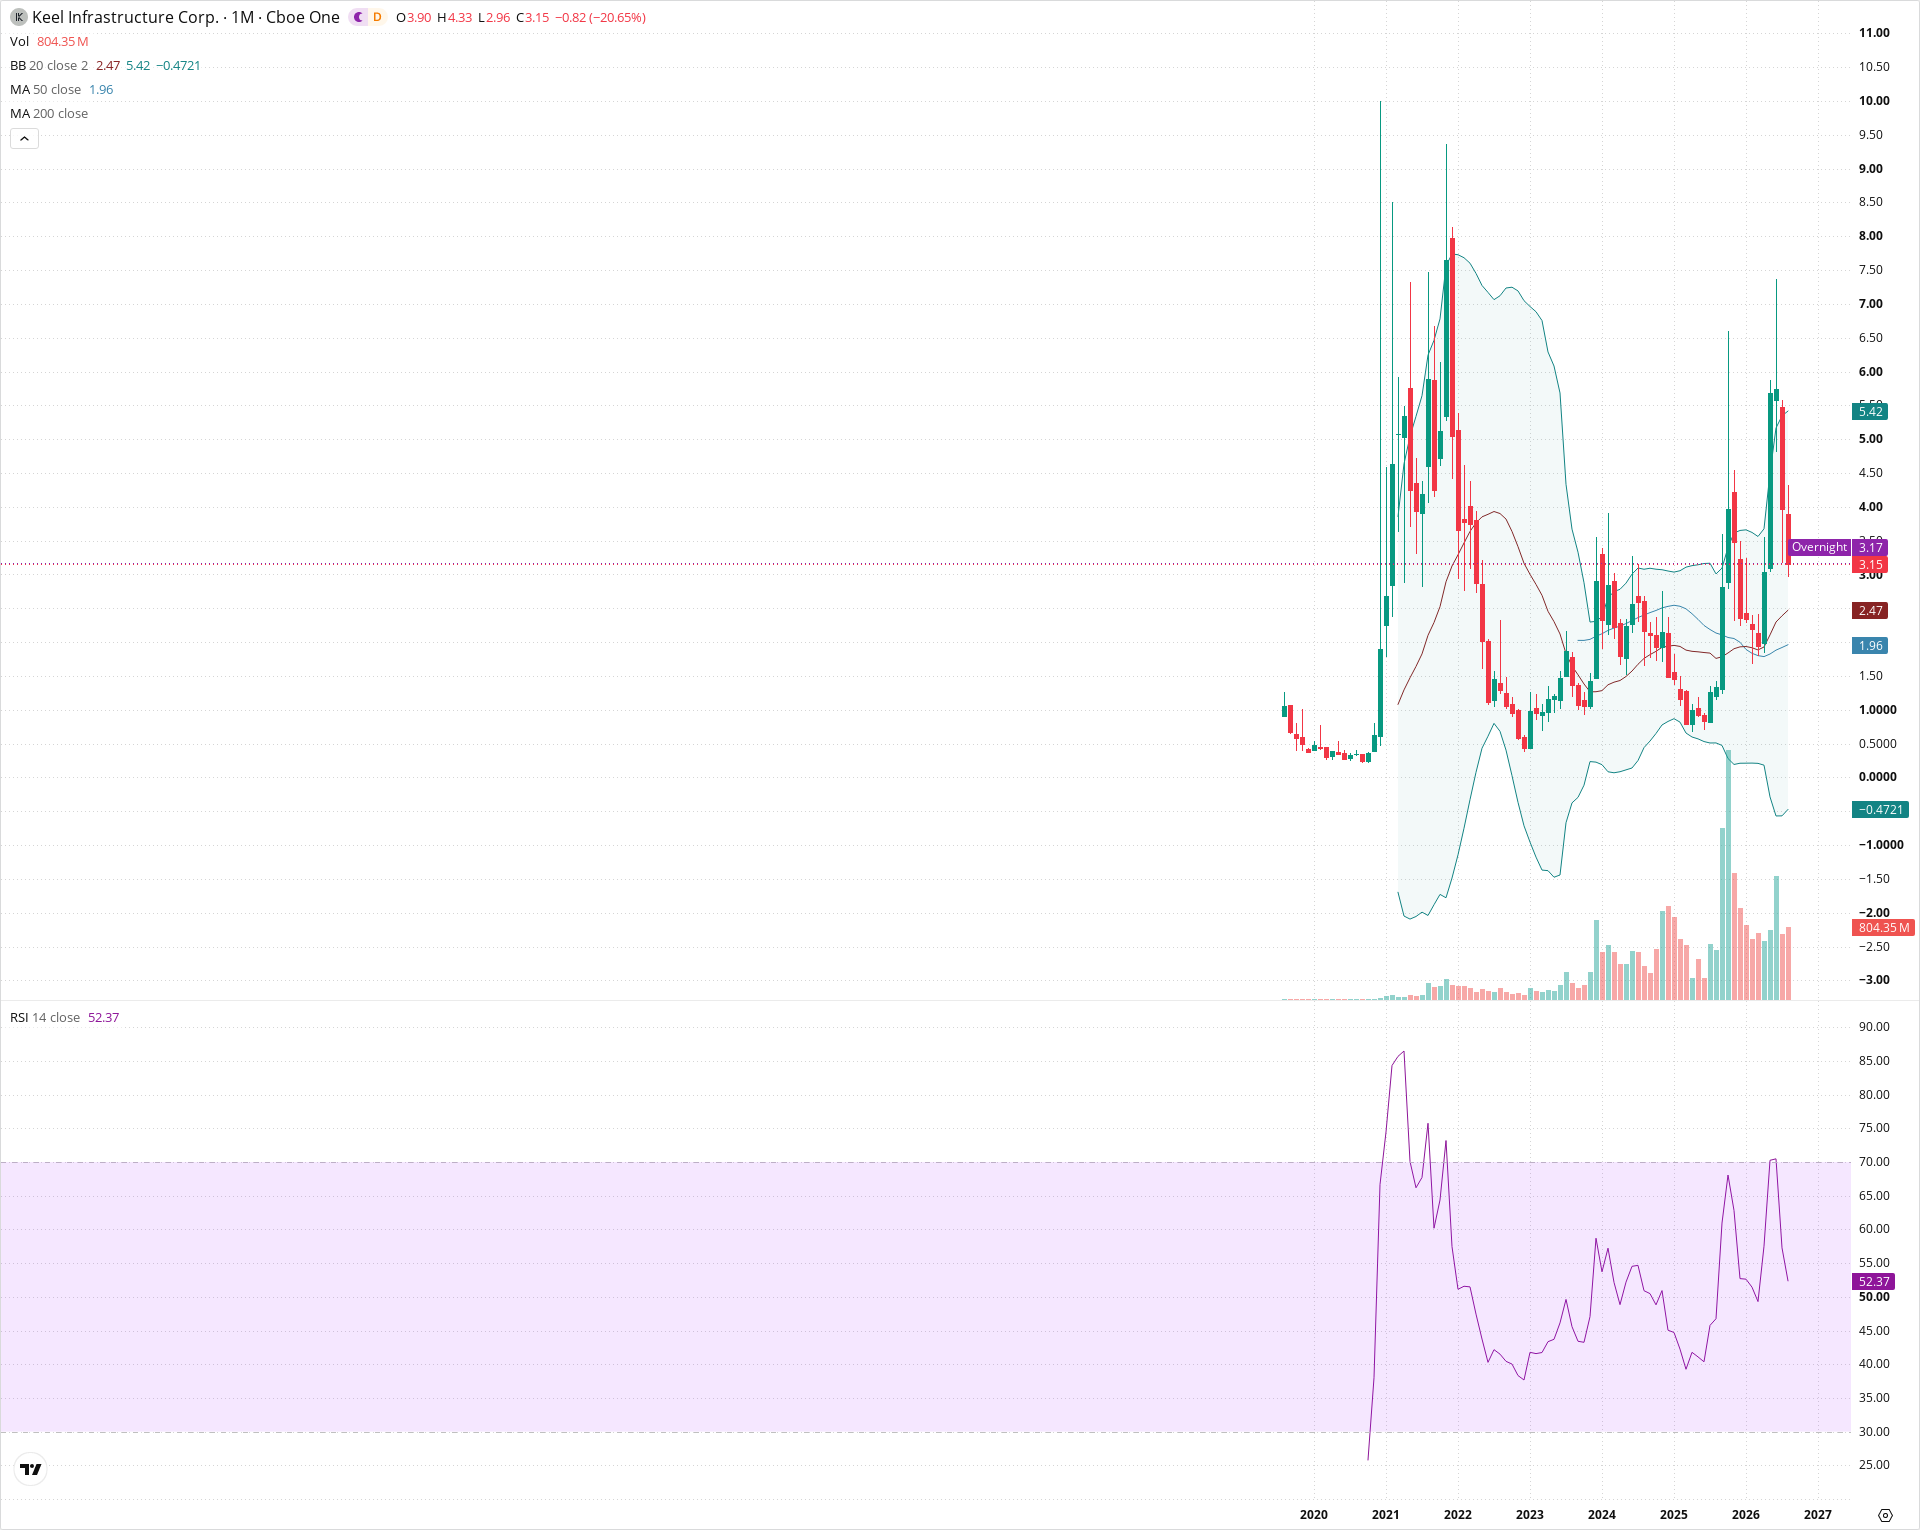
KEEL recently surged out of a multi-year accumulation base, testing major historical resistance near $7.50 before pulling back sharply to its current price of 3.15. While the current monthly candle reflects strong short-term selling pressure, the stock maintains a higher low structure above the rising 20-month and 50-month moving averages. A successful defense of support in the $2.00–$2.50 region will be critical to sustaining the broader secular recovery.
Included In Lists
Related Tickers of Interest
KEEL Monthly Chart
Sentiment
Short-term Sentiment (days to weeks): Bearish
The stock has experienced a sharp monthly rejection from multi-year resistance near $7.50, printing a heavy pullback candle back toward the mid-Bollinger band.
Long-term Sentiment (weeks to months): Neutral
Price remains above the 50-month SMA ($1.96) and 20-month SMA ($2.47) following a multi-year base breakout, but heavy overhead supply and historical spike-and-fade behavior keep the secular outlook transitional.
Report Metadata
- Timeframe: monthly
- Generated at: 2026-09-01T06:42:06.570Z
- Model: gemini-3.7-flash
Support Price Levels
| Level | Range | Strength | Notes |
|---|---|---|---|
| $2.45 | $2.40 - $2.50 | Strong | Confluence of the 20-month simple moving average and prior multi-month consolidation zone. |
| $1.00 | $0.80 - $1.20 | Strong | Major secular base support established during the 2022–2024 bottoming range. |
Resistance Price Levels
| Level | Range | Strength | Notes |
|---|---|---|---|
| $5.45 | $5.40 - $5.50 | Weak | Upper Bollinger Band zone marking the recent monthly candle high cluster. |
| $8.50 | $7.50 - $9.50 | Strong | Multi-year peak resistance defined by the 2021 spike highs and recent secular upper wicks. |
Potential Chart Patterns in Formation
| Strength | Pattern | Signal | Target | Details |
|---|---|---|---|---|
| Weak | Multi-Year Base Breakout and Retest | Bullish | $7.50 | A broad accumulation base built between $0.80 and $3.00 from 2023 to 2025 broke out sharply on elevated volume and is currently undergoing a secondary retest of the breakout zone. |
Frequently Asked Questions about KEEL
What is the current sentiment for KEEL?
The short-term sentiment for KEEL is currently Bearish because The stock has experienced a sharp monthly rejection from multi-year resistance near $7.50, printing a heavy pullback candle back toward the mid-Bollinger band.. The long-term trend is classified as Neutral.
What are the key support levels for KEEL?
StockDips.AI has identified key support levels for KEEL at $2.45 and $1.00. These levels may represent potential accumulation zones where buying interest could emerge.
Is KEEL in a significant dip or a Value Dip right now?
KEEL has a Value Score of 86/100. It is currently flagged as a significant dip in the Top Dips list. It is not listed as a Value Dip because the long-term sentiment or value-score threshold does not qualify.
View the full interactive analysis on StockDips.AI.