LLY Weekly Technical Analysis
Eli Lilly & Co.
Pharma leader in diabetes and obesity treatments including Mounjaro and Zepbound.
LLY Technical Analysis Summary
LLY remains in a commanding, multi-year structural uptrend, consistently trading above its rising 50-week and 200-week moving averages. Recent price action highlights a powerful breakout from a multi-month base to new all-time highs, supported by accelerating bullish momentum on the MACD. While short-term over-extension is possible given the steep ascent, the long-term technical picture overwhelmingly favors continued upside, with significant structural support located near the $1000 level.
Included In Lists
Related Tickers of Interest
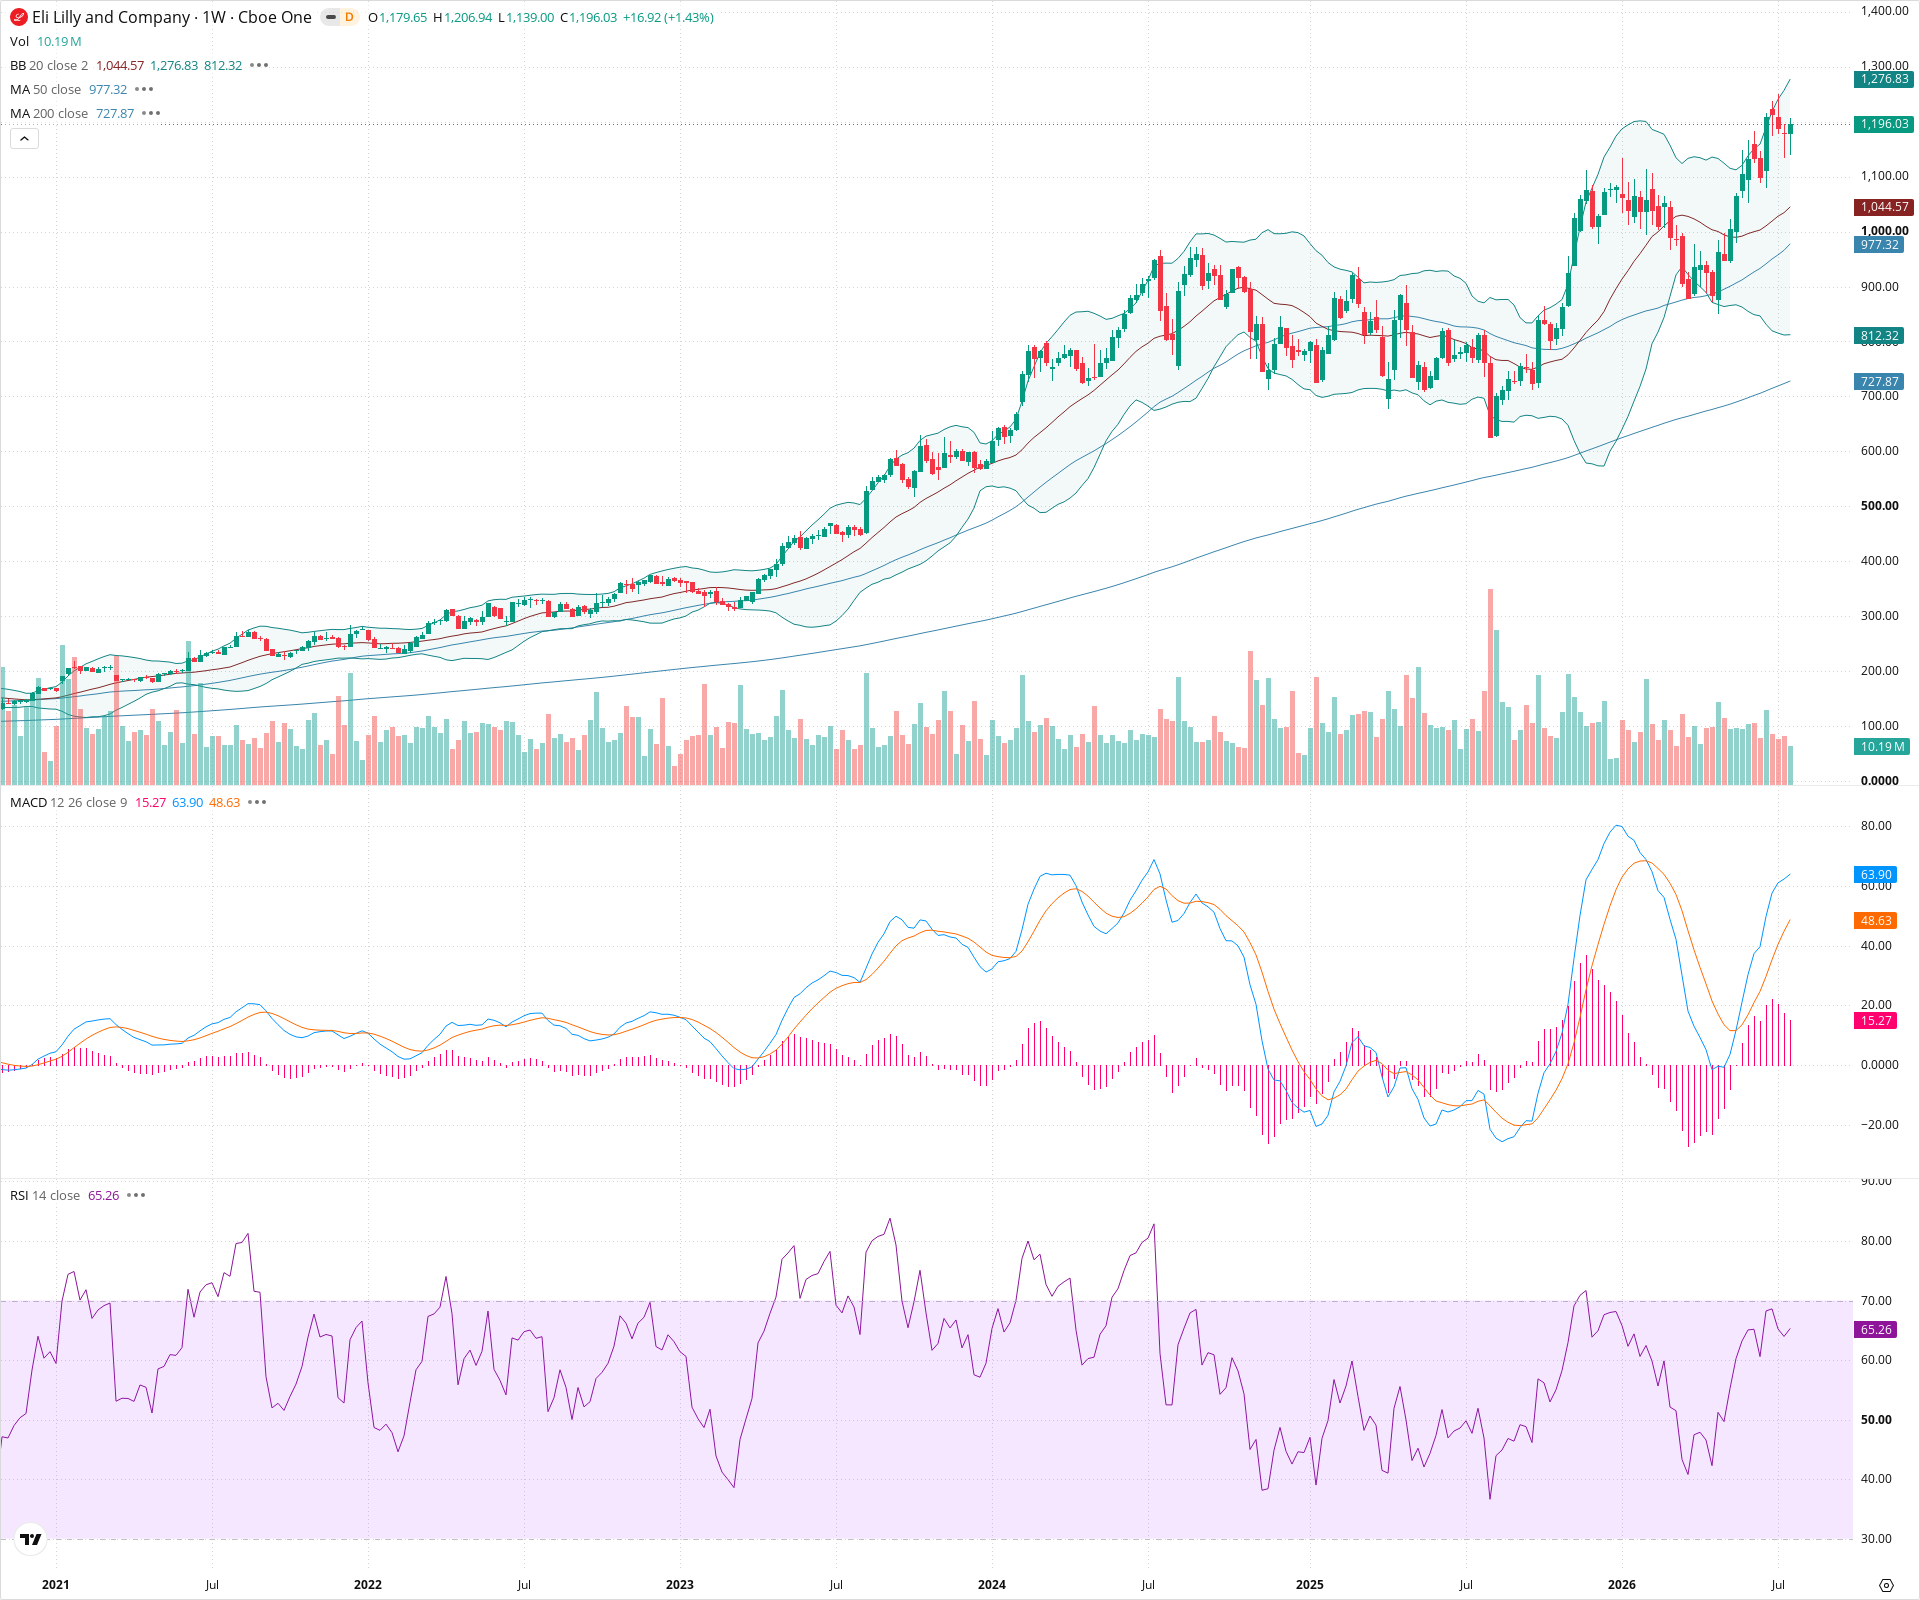
LLY Weekly Chart
Sentiment
Short-term Sentiment (days to weeks): Bullish
Price is breaking out to new all-time highs, pushing against the upper Bollinger Band. Bullish momentum is accelerating, confirmed by a widening MACD above the zero line and a rising RSI approaching overbought territory but not yet exhausted.
Long-term Sentiment (weeks to months): Bullish
The chart exhibits a powerful, multi-year structural uptrend characterized by consistent higher highs and higher lows. Price remains positioned well above the firmly rising 50-week and 200-week SMAs, indicating sustained long-term buying pressure.
Report Metadata
- Timeframe: weekly
- Generated at: 2026-07-25T09:13:09.098Z
- Model: gemini-3.1-pro-preview
Support Price Levels
| Level | Range | Strength | Notes |
|---|---|---|---|
| $1,040.00 | $1,030.00 - $1,050.00 | Weak | First line of dynamic support near the 20-week SMA (middle Bollinger Band) and recent minor consolidation. |
| $985.00 | $970.00 - $1,000.00 | Strong | Major structural support zone aligning with previous consolidation peaks, the breakout level, and the currently rising 50-week SMA. |
| $740.00 | $720.00 - $760.00 | Strong | Deep structural support marking a major previous swing low and roughly aligning with the long-term 200-week SMA. |
Resistance Price Levels
| Level | Range | Strength | Notes |
|---|---|---|---|
| $1,205.00 | $1,200.00 - $1,210.00 | Weak | Immediate resistance at the current all-time high wick; price is actively testing this level in price discovery mode. |
| $1,275.00 | $1,270.00 - $1,280.00 | Weak | Dynamic resistance projected by the current location of the upper Bollinger Band. |
Potential Chart Patterns in Formation
| Strength | Pattern | Signal | Target | Details |
|---|---|---|---|---|
| Strong | Base Breakout | Bullish | N/A | Price recently broke out to the upside from a large, multi-month consolidation base that formed between roughly $750 and $1000. |
| Strong | Long-Term Uptrend | Bullish | N/A | A persistent sequence of higher highs and higher lows sustained over several years, supported by all major moving averages. |
Frequently Asked Questions about LLY
What is the current sentiment for LLY?
The short-term sentiment for LLY is currently Bullish because Price is breaking out to new all-time highs, pushing against the upper Bollinger Band. Bullish momentum is accelerating, confirmed by a widening MACD above the zero line and a rising RSI approaching overbought territory but not yet exhausted.. The long-term trend is classified as Bullish.
What are the key support levels for LLY?
StockDips.AI has identified key support levels for LLY at $1,040.00 and $985.00. These levels may represent potential accumulation zones where buying interest could emerge.
Is LLY in a significant dip or a Value Dip right now?
LLY has a Value Score of 45/100. It is not currently flagged as a significant dip in the Top Dips list. It is not listed as a Value Dip because the long-term sentiment or value-score threshold does not qualify.
View the full interactive analysis on StockDips.AI.