LLY Monthly Technical Analysis
Eli Lilly & Co.
Pharma leader in diabetes and obesity treatments including Mounjaro and Zepbound.
LLY Technical Analysis Summary
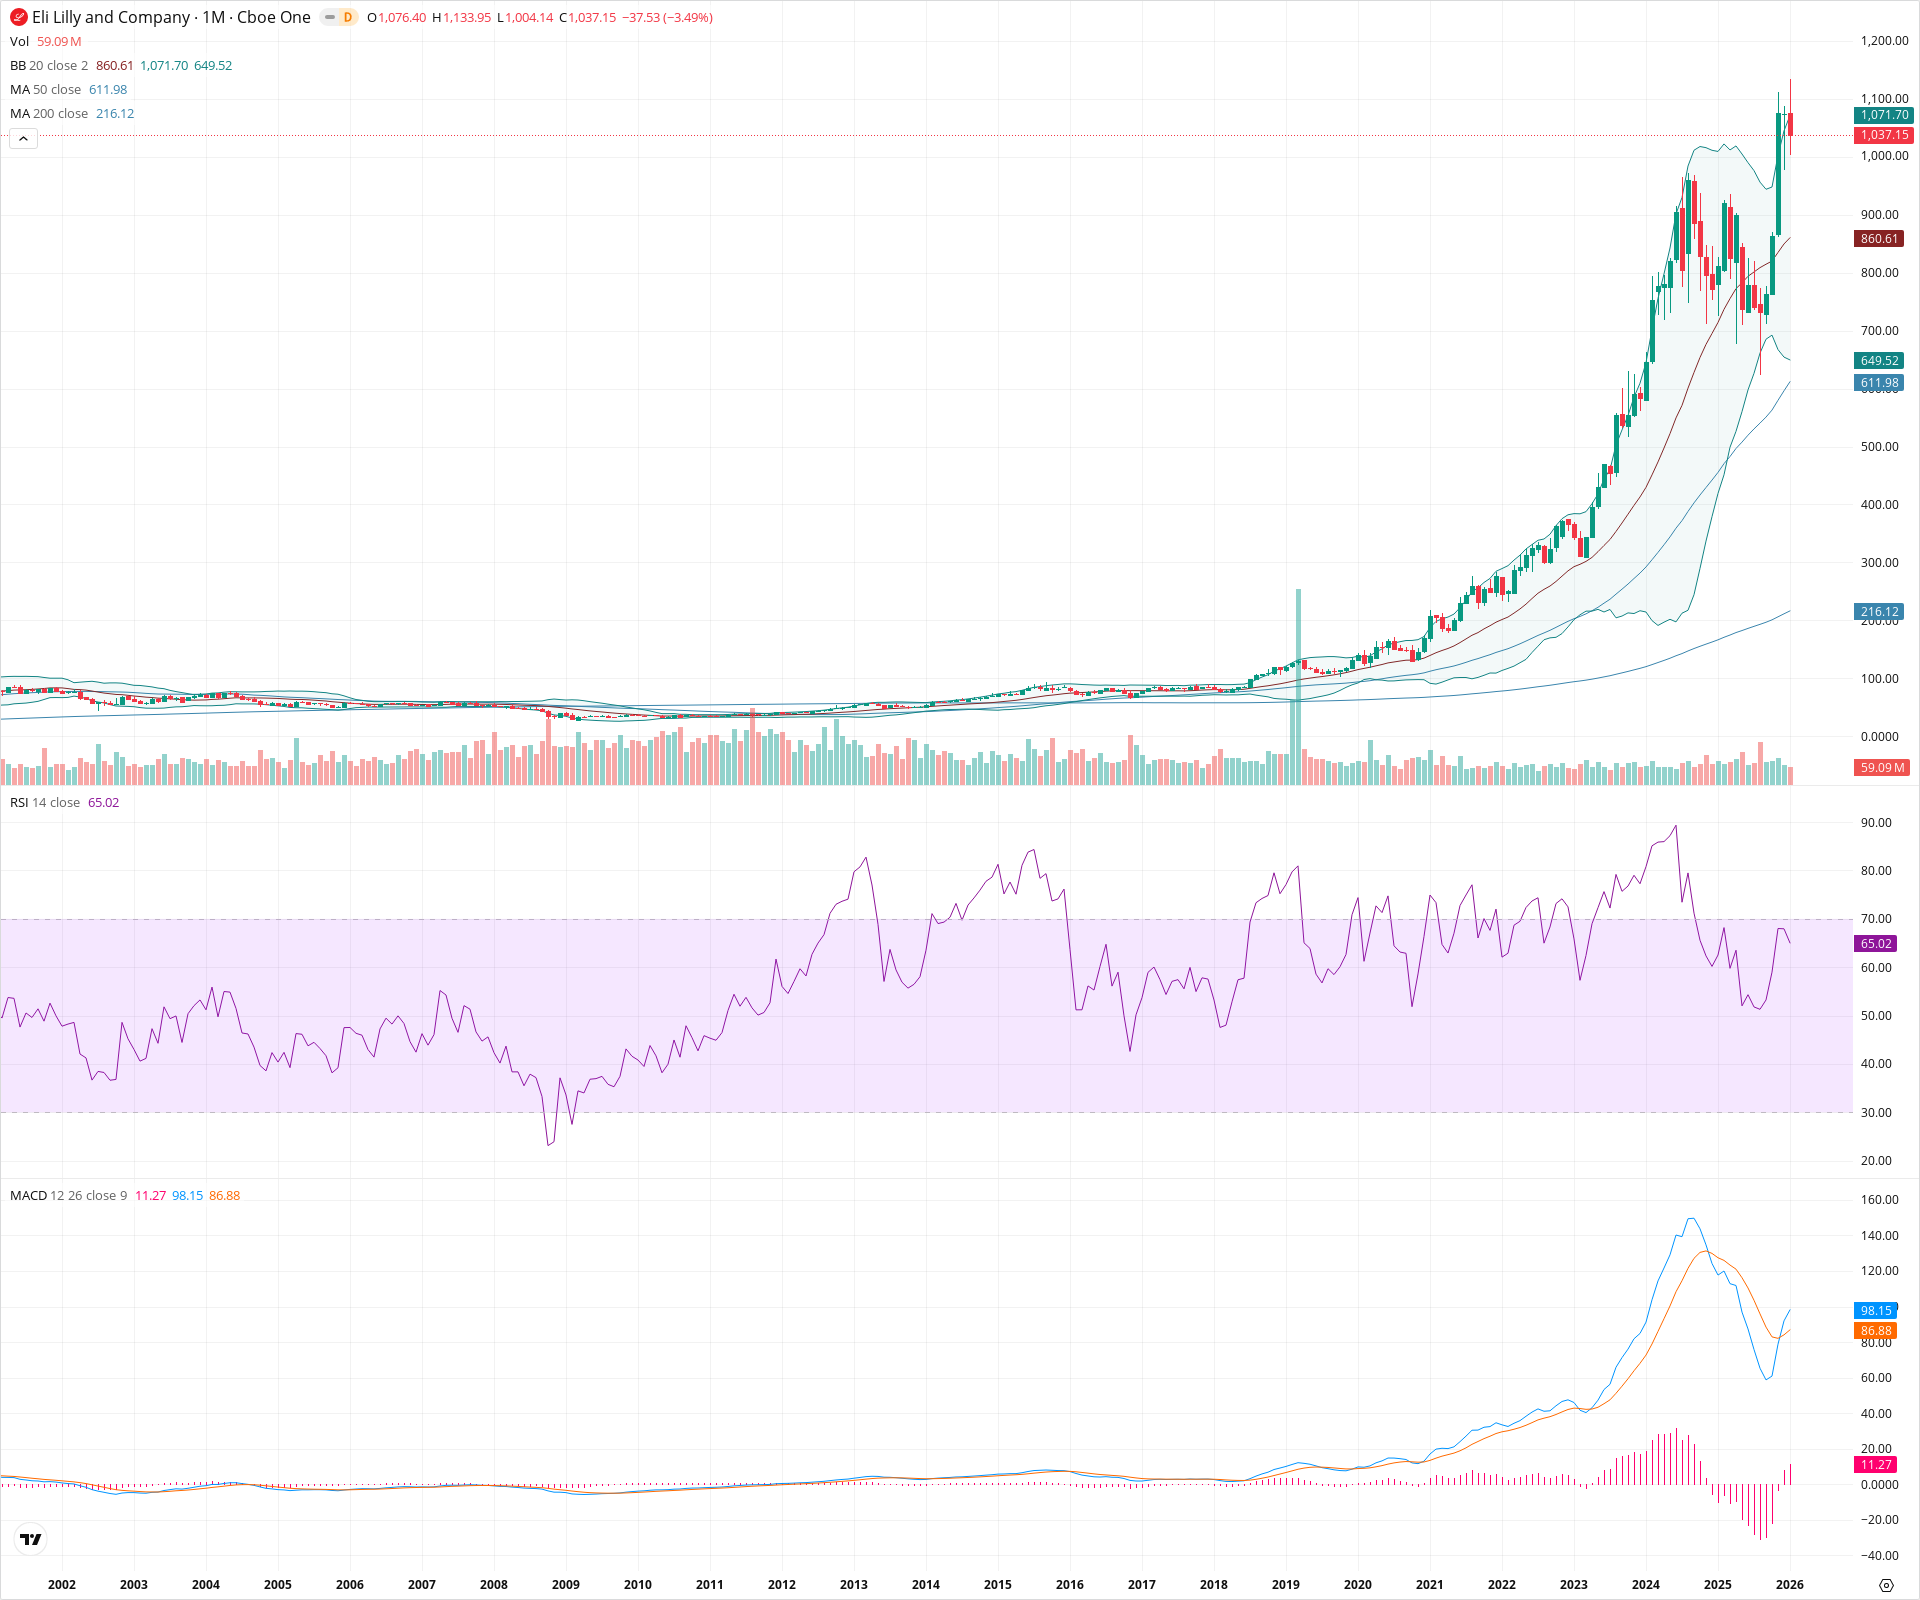
LLY is exhibiting a classic parabolic bull run, trading well above all major long-term moving averages with robust momentum. While the RSI is cooling from extreme overbought levels and the MACD histogram shows slight deceleration, the primary trend remains strictly bullish. The price is currently consolidating near all-time highs, with the 20-month SMA serving as the critical trailing support level for the long-term trend.
Included In Lists
Related Tickers of Interest
LLY Monthly Chart
Sentiment
Short-term Sentiment (days to weeks): Bullish
While the current candle shows a minor pullback (-3.49%) and consolidation, the stock remains in a strong uptrend just below all-time highs, holding above psychological support at 1,000.
Long-term Sentiment (weeks to months): Bullish
The stock is in a powerful secular uptrend, trading significantly above rising 20, 50, and 200-month SMAs. The MACD indicates a confirmed bullish regime with no major structural breakdown.
Report Metadata
- Timeframe: monthly
- Generated at: 2026-02-02T06:45:14.864Z
- Model: gemini-3-pro-preview
Support Price Levels
| Level | Range | Strength | Notes |
|---|---|---|---|
| $1,002.50 | $1,000.00 - $1,005.00 | Weak | Immediate psychological support and the low of the current monthly candle. |
| $870.00 | $860.00 - $880.00 | Strong | Aligns with the 20-month SMA (Bollinger Band basis) which has acted as dynamic support. |
| $765.00 | $730.00 - $800.00 | Strong | Major prior consolidation zone and breakout level before the most recent parabolic leg. |
Resistance Price Levels
| Level | Range | Strength | Notes |
|---|---|---|---|
| $1,133.50 | $1,133.00 - $1,134.00 | Strong | The current All-Time High established recently. |
| $1,225.00 | $1,200.00 - $1,250.00 | Weak | Psychological extension target for the next leg up. |
Potential Chart Patterns in Formation
| Strength | Pattern | Signal | Target | Details |
|---|---|---|---|---|
| Strong | Parabolic Advance | Bullish | N/A | Price has accelerated vertically since 2023, expanding far away from the 50 and 200 SMAs. |
| Weak | High-Level Consolidation | Neutral | N/A | Recent candles show hesitation and sideways movement near highs, allowing indicators like RSI to cool off. |
Frequently Asked Questions about LLY
What is the current sentiment for LLY?
The short-term sentiment for LLY is currently Bullish because While the current candle shows a minor pullback (-3.49%) and consolidation, the stock remains in a strong uptrend just below all-time highs, holding above psychological support at 1,000.. The long-term trend is classified as Bullish.
What are the key support levels for LLY?
StockDips.AI has identified key support levels for LLY at $1,002.50 and $870.00. These levels may represent potential accumulation zones where buying interest could emerge.
Is LLY in a significant dip or a Value Dip right now?
LLY has a Value Score of 45/100. It is not currently flagged as a significant dip in the Top Dips list. It is not listed as a Value Dip because the long-term sentiment or value-score threshold does not qualify.
View the full interactive analysis on StockDips.AI.