NVO Monthly Technical Analysis
Novo Nordisk A/S
Danish pharma specializing in diabetes and weight-loss drugs such as Ozempic and Wegovy.
NVO Technical Analysis Summary
NVO is in the midst of a severe mean-reversion phase following a parabolic run-up, currently attempting to find a floor near the 50.00 level. While the long-term secular bull case is technically alive above the 200-month SMA, the deeply negative monthly MACD and loss of the 50-month SMA suggest the asset is in a prolonged transitional or corrective period. Investors should watch for a definitive base formation before assuming the downtrend has terminated.
Included In Lists
Related Tickers of Interest
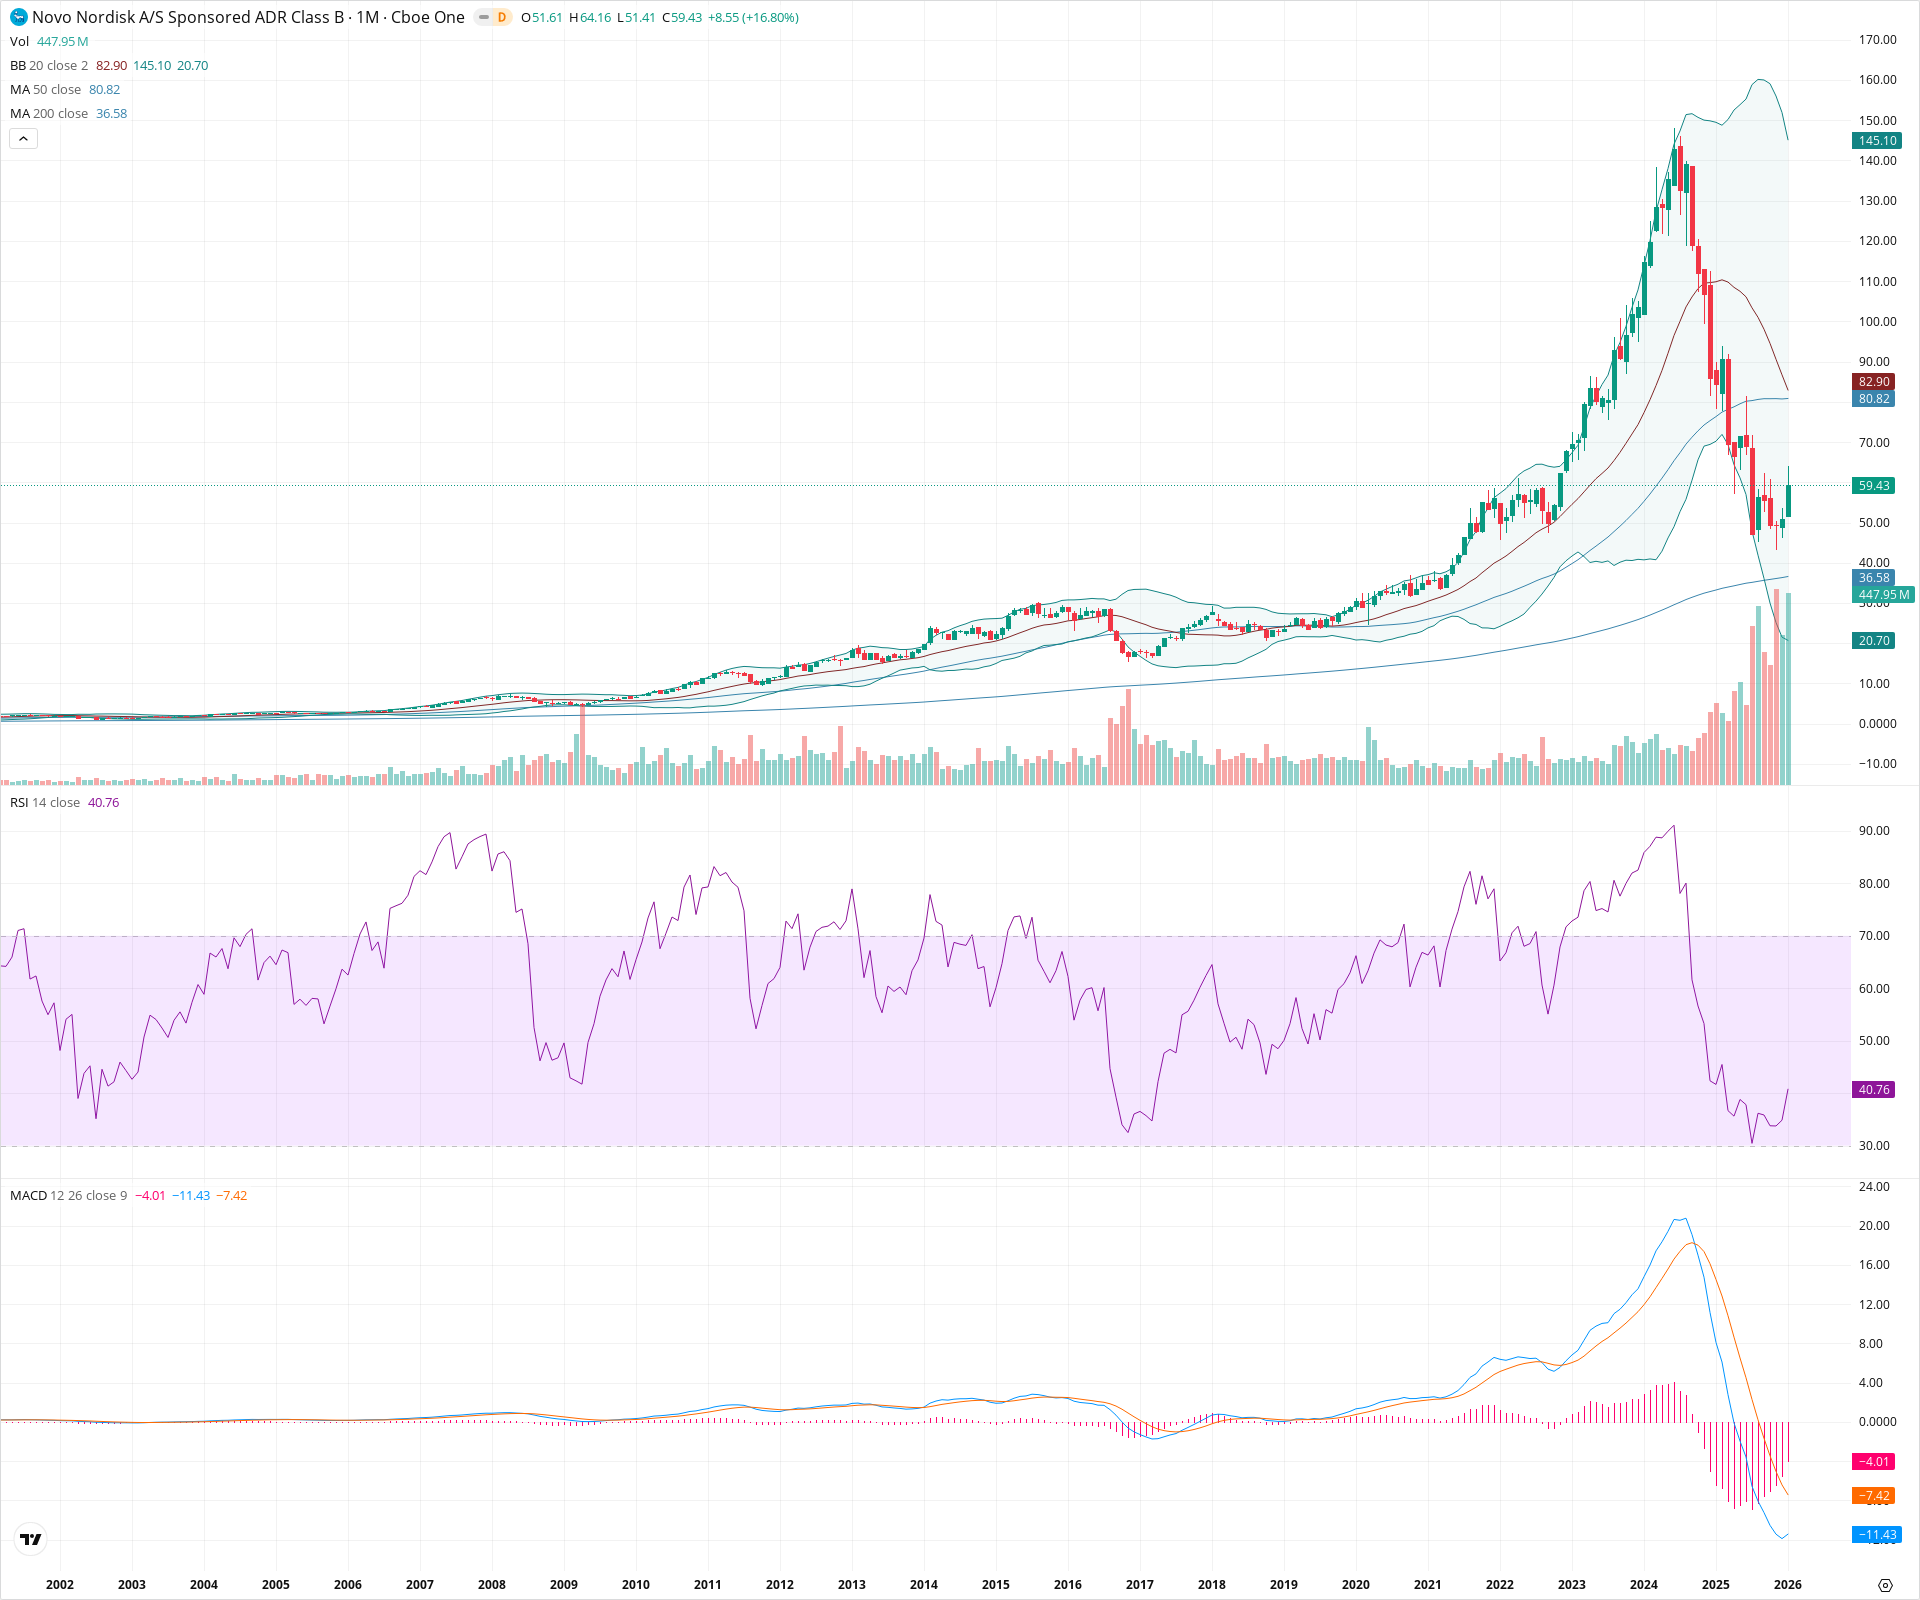
NVO Monthly Chart
Sentiment
Short-term Sentiment (days to weeks): Bearish
Despite the current month's strong bounce of +16.80%, the medium-term trend remains firmly negative, with price trading below the 20-month and 50-month SMAs and momentum indicators showing no confirmed reversal.
Long-term Sentiment (weeks to months): Neutral
The stock has suffered significant structural damage by losing the 50-month SMA support, entering a deep corrective regime; however, the long-term uptrend is technically preserved as price remains above the rising 200-month SMA.
Report Metadata
- Timeframe: monthly
- Generated at: 2026-02-02T06:48:18.911Z
- Model: gemini-3-pro-preview
Support Price Levels
| Level | Range | Strength | Notes |
|---|---|---|---|
| $51.00 | $50.00 - $52.00 | Strong | Immediate monthly swing low and confluence with previous breakout consolidation zones from 2021. |
| $36.50 | $36.00 - $37.00 | Strong | Major secular support at the 200-month Simple Moving Average (36.58). |
Resistance Price Levels
| Level | Range | Strength | Notes |
|---|---|---|---|
| $81.50 | $80.00 - $83.00 | Strong | Convergence of the 50-month SMA (80.82) and the Bollinger Band basis line, acting as major overhead resistance. |
| $142.50 | $140.00 - $145.00 | Strong | All-time high structural peak and upper Bollinger Band boundary. |
Potential Chart Patterns in Formation
| Strength | Pattern | Signal | Target | Details |
|---|---|---|---|---|
| Strong | Parabolic Breakdown | Bearish | N/A | A vertical 'blow-off top' followed by a V-shaped reversal, resulting in a ~60% decline from highs and breaking the intermediate uptrend structure. |
Frequently Asked Questions about NVO
What is the current sentiment for NVO?
The short-term sentiment for NVO is currently Bearish because Despite the current month's strong bounce of +16.80%, the medium-term trend remains firmly negative, with price trading below the 20-month and 50-month SMAs and momentum indicators showing no confirmed reversal.. The long-term trend is classified as Neutral.
What are the key support levels for NVO?
StockDips.AI has identified key support levels for NVO at $51.00 and $36.50. These levels may represent potential accumulation zones where buying interest could emerge.
Is NVO in a significant dip or a Value Dip right now?
NVO has a Value Score of 51/100. It is not currently flagged as a significant dip in the Top Dips list. It is not listed as a Value Dip because the long-term sentiment or value-score threshold does not qualify.
View the full interactive analysis on StockDips.AI.