SHOP Daily Technical Analysis
Shopify Inc
Provides e-commerce tools and payment solutions for online businesses.
SHOP Technical Analysis Summary
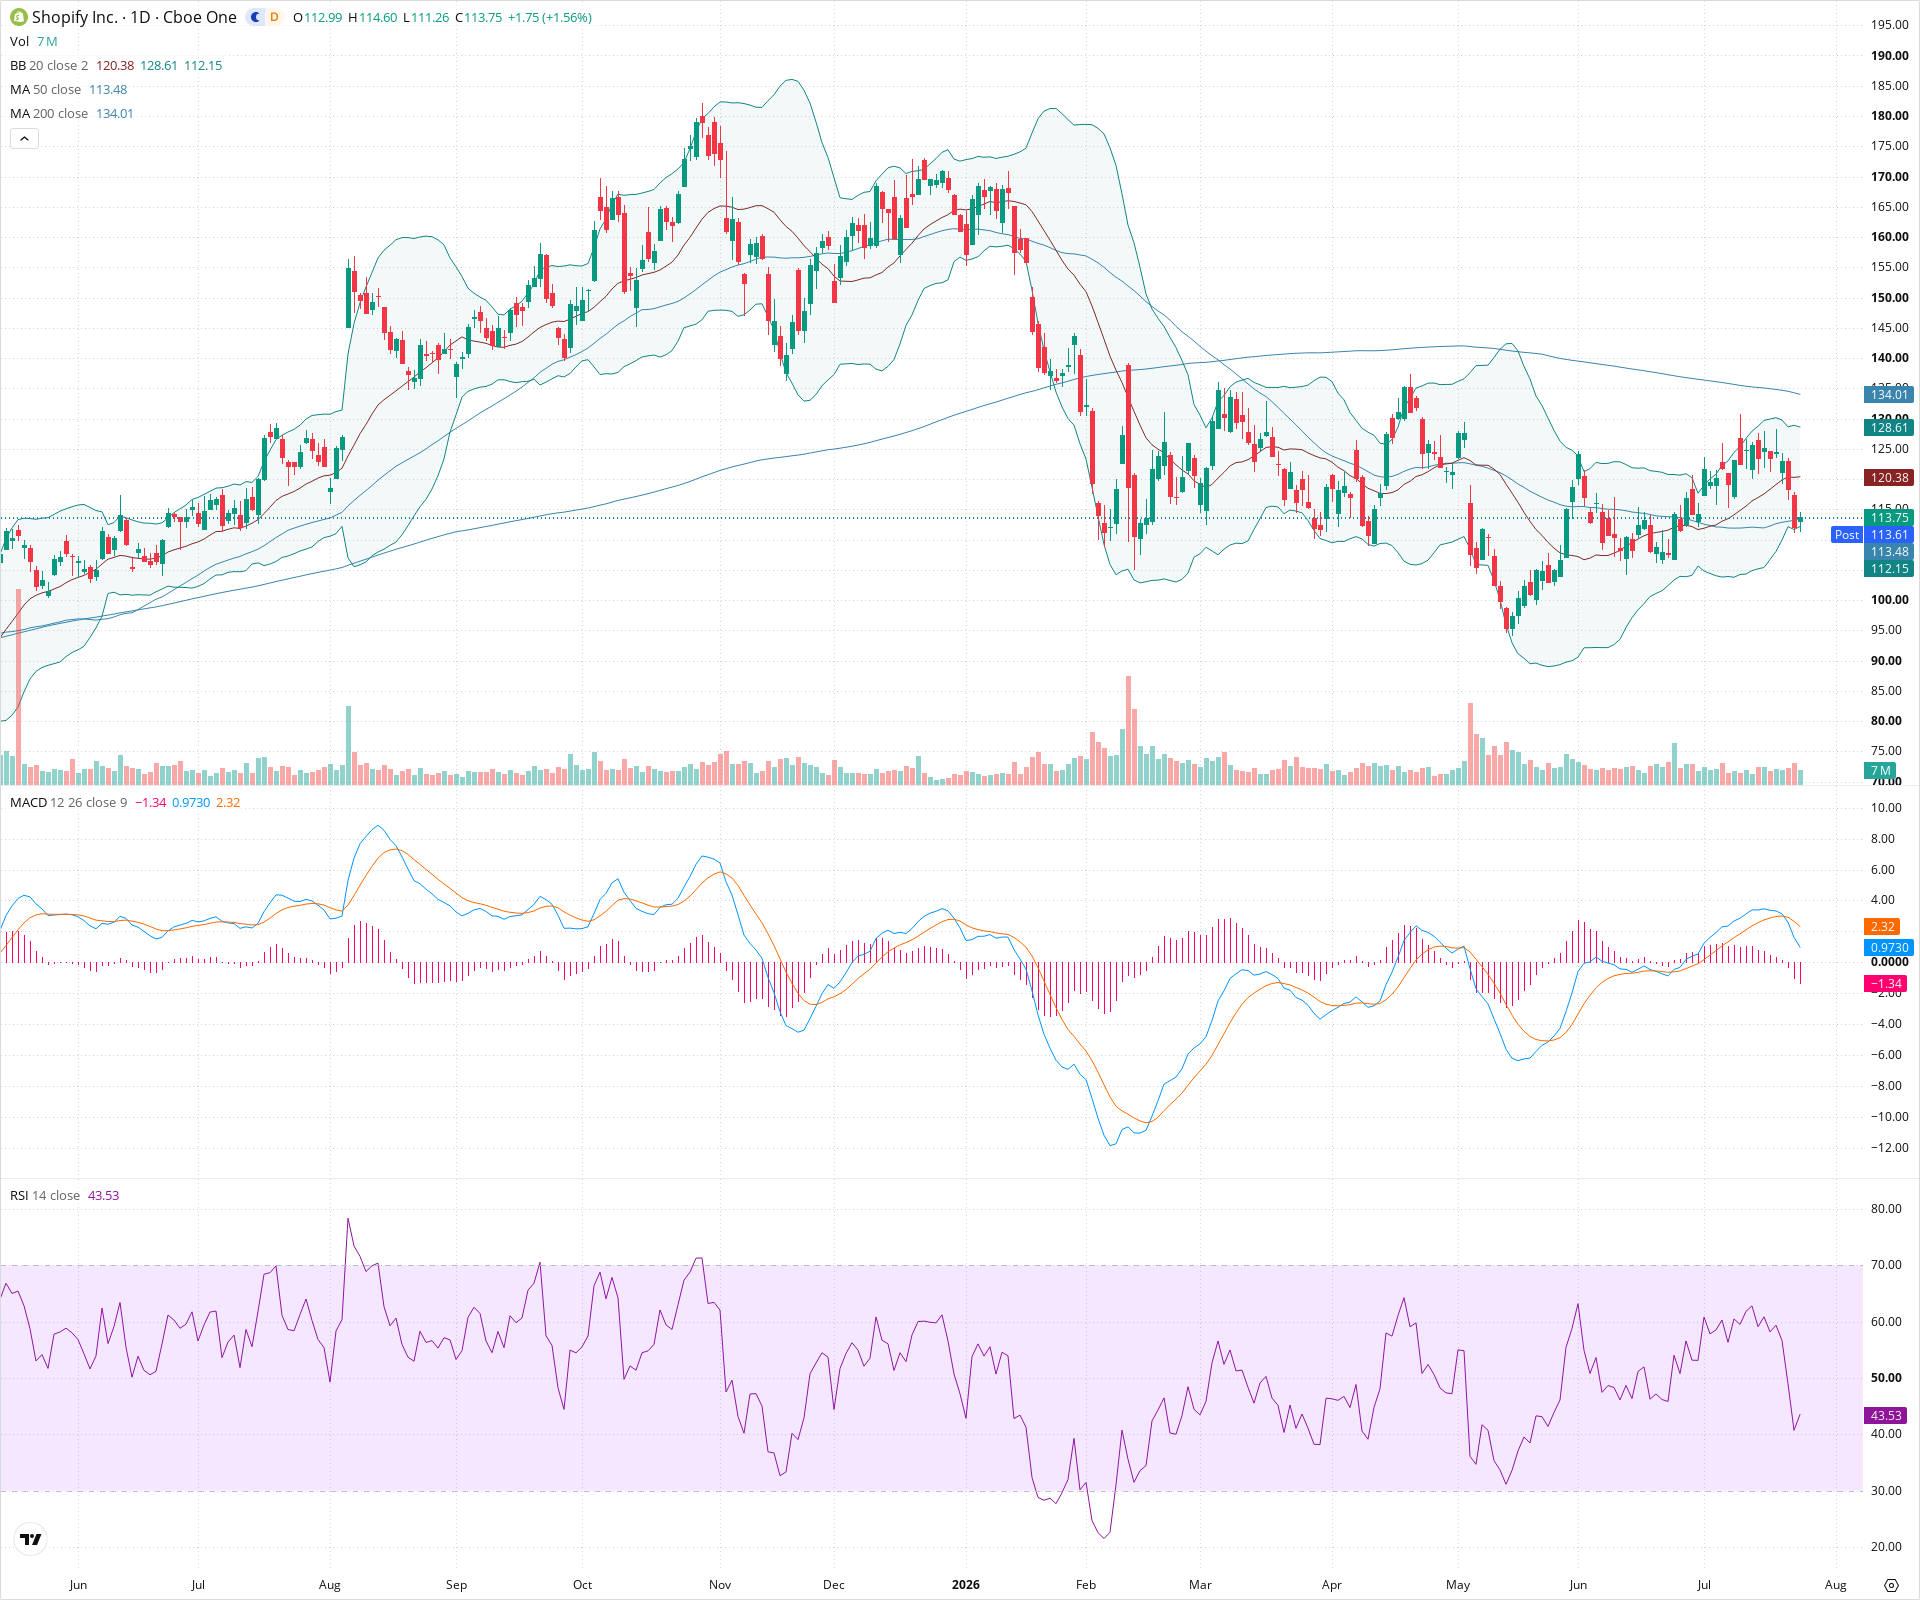
SHOP is currently exhibiting a long-term bearish structure, remaining decisively below its declining 200-day moving average. In the medium term, it appears to be attempting to carve out a base following a sharp decline to the $90 level, establishing a broad consolidation zone. Short-term momentum indicators like MACD and RSI are currently negative to neutral, suggesting that further chop or a retest of lower support levels is likely before any sustained structural breakout can occur.
Included In Lists
Related Tickers of Interest
SHOP Daily Chart
Sentiment
Short-term Sentiment (days to weeks): Neutral
Price is consolidating around the 50-day SMA after a recent pullback. Momentum is cooling, with the MACD histogram turning negative and RSI dropping below 50, indicating a lack of strong directional conviction in the near term.
Long-term Sentiment (weeks to months): Bearish
The stock remains in a prominent long-term downtrend, trading significantly below a steeply declining 200-day SMA. While it has bounced from deep lows, the overarching macro structure consists of lower highs and lower lows.
Report Metadata
- Timeframe: daily
- Generated at: 2026-07-24T21:12:13.900Z
- Model: gemini-3.1-pro-preview
Support Price Levels
| Level | Range | Strength | Notes |
|---|---|---|---|
| $107.50 | $105.00 - $110.00 | Strong | Recent swing low consolidation zone and a key psychological support area. |
| $92.50 | $90.00 - $95.00 | Strong | Major structural swing low established earlier in the year; acts as critical macro support. |
Resistance Price Levels
| Level | Range | Strength | Notes |
|---|---|---|---|
| $127.50 | $125.00 - $130.00 | Strong | Recent swing high where price was rejected near the upper Bollinger Band. |
| $134.00 | $133.00 - $135.00 | Strong | Dynamic resistance provided by the descending 200-day Simple Moving Average. |
Potential Chart Patterns in Formation
| Strength | Pattern | Signal | Target | Details |
|---|---|---|---|---|
| Weak | Consolidation Range | Neutral | N/A | The stock is currently trading in a wide, choppy range roughly between 105 and 130, attempting to build a base after a prolonged and severe downtrend. |
Frequently Asked Questions about SHOP
What is the current sentiment for SHOP?
The short-term sentiment for SHOP is currently Neutral because Price is consolidating around the 50-day SMA after a recent pullback. Momentum is cooling, with the MACD histogram turning negative and RSI dropping below 50, indicating a lack of strong directional conviction in the near term.. The long-term trend is classified as Bearish.
What are the key support levels for SHOP?
StockDips.AI has identified key support levels for SHOP at $107.50 and $92.50. These levels may represent potential accumulation zones where buying interest could emerge.
Is SHOP in a significant dip or a Value Dip right now?
SHOP has a Value Score of 69/100. It is not currently flagged as a significant dip in the Top Dips list. It is not listed as a Value Dip because the long-term sentiment or value-score threshold does not qualify.
View the full interactive analysis on StockDips.AI.