PYPL Weekly Technical Analysis
PayPal Holdings, Inc.
Leading global digital payments platform enabling online payments, peer-to-peer transfers, and merchant payment processing.
PYPL Technical Analysis Summary
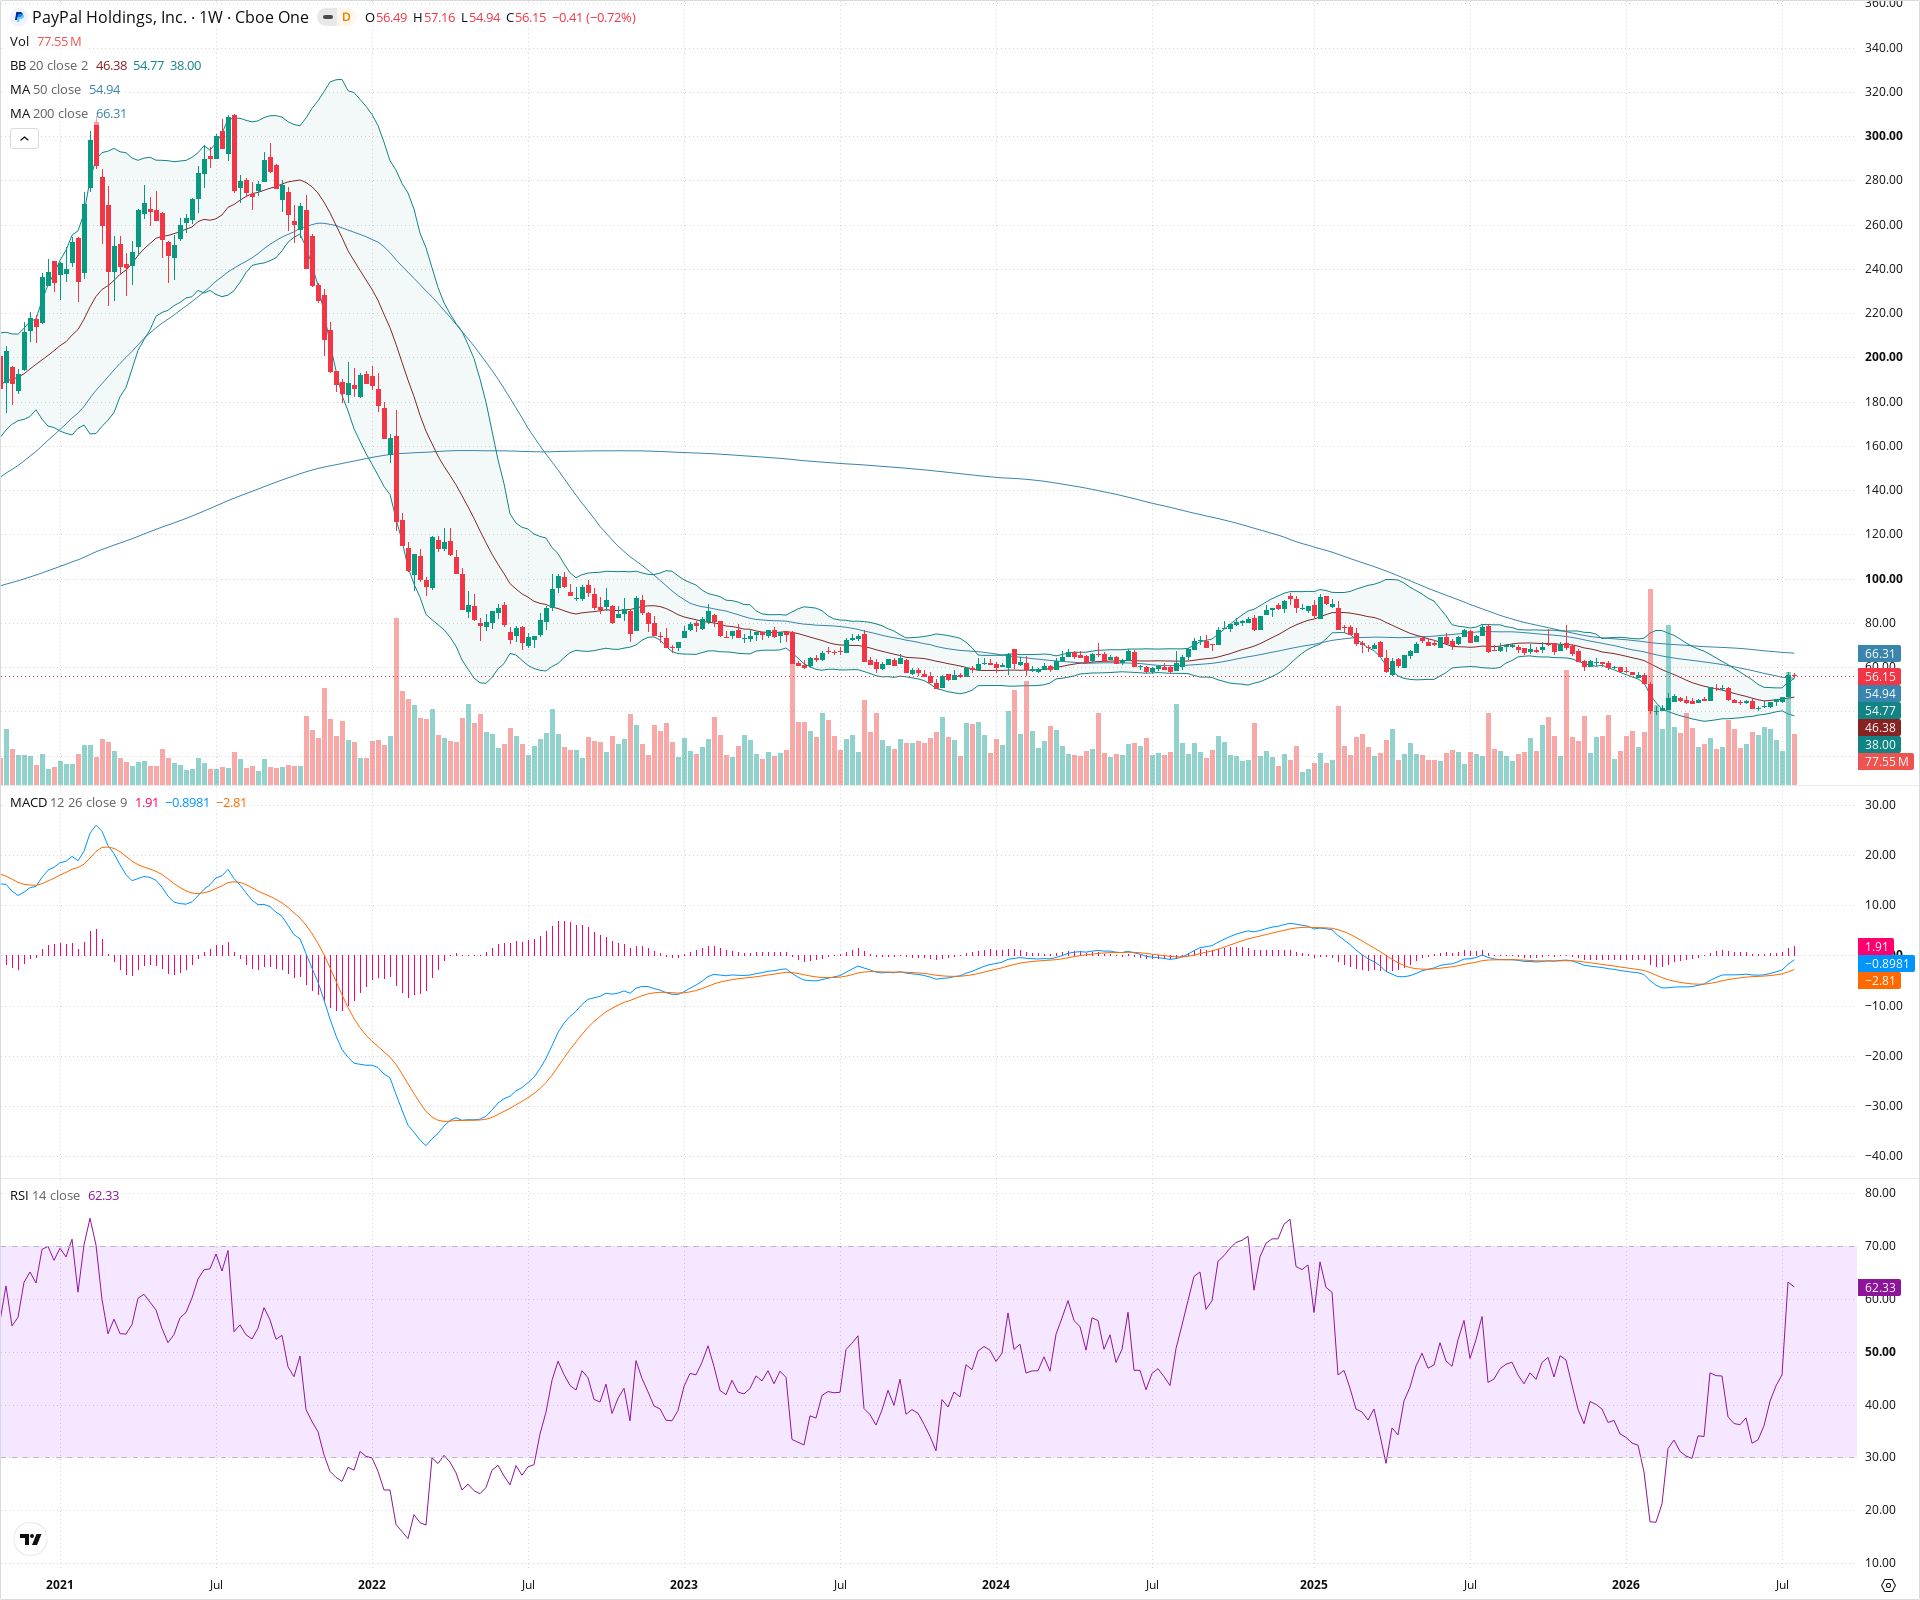
PYPL shows signs of a long-term bottoming process after a severe multi-year downtrend. Short-term momentum is bullish as price reclaims the 50-week SMA with supportive MACD and RSI. A break above the 200-week SMA near 66-70 is required to confirm a long-term trend reversal.
Included In Lists
Related Tickers of Interest
PYPL Weekly Chart
Sentiment
Short-term Sentiment (days to weeks): Bullish
Price is rising, holding above the 20-week and 50-week SMAs. MACD is positive and trending higher, while RSI indicates bullish momentum above 60.
Long-term Sentiment (weeks to months): Neutral
The long-term trend has been bearish, but a base appears to be forming. Price has recently crossed above the 50-week SMA, but the 200-week SMA remains above as major resistance.
Report Metadata
- Timeframe: weekly
- Generated at: 2026-07-25T09:08:55.211Z
- Model: gemini-3.1-pro-preview
Support Price Levels
| Level | Range | Strength | Notes |
|---|---|---|---|
| $54.50 | $54.00 - $55.00 | Strong | Confluence of the 20-week and 50-week SMAs, acting as dynamic support. |
| $48.00 | $46.00 - $50.00 | Strong | Major structural low area formed during the prolonged basing phase. |
Resistance Price Levels
| Level | Range | Strength | Notes |
|---|---|---|---|
| $68.00 | $66.00 - $70.00 | Strong | Confluence of the 200-week SMA and prior structural resistance. |
| $87.50 | $85.00 - $90.00 | Strong | Significant prior swing high and consolidation zone from the long-term downtrend. |
Potential Chart Patterns in Formation
| Strength | Pattern | Signal | Target | Details |
|---|---|---|---|---|
| Strong | Rounding Bottom / Base Building | Bullish | N/A | Prolonged multi-year sideways consolidation after a massive downtrend, suggesting exhaustion of selling pressure and potential trend reversal. |
Frequently Asked Questions about PYPL
What is the current sentiment for PYPL?
The short-term sentiment for PYPL is currently Bullish because Price is rising, holding above the 20-week and 50-week SMAs. MACD is positive and trending higher, while RSI indicates bullish momentum above 60.. The long-term trend is classified as Neutral.
What are the key support levels for PYPL?
StockDips.AI has identified key support levels for PYPL at $54.50 and $48.00. These levels may represent potential accumulation zones where buying interest could emerge.
Is PYPL in a significant dip or a Value Dip right now?
PYPL has a Value Score of 56/100. It is not currently flagged as a significant dip in the Top Dips list. It is not listed as a Value Dip because the long-term sentiment or value-score threshold does not qualify.
View the full interactive analysis on StockDips.AI.