PYPL Monthly Technical Analysis
PayPal Holdings, Inc.
Leading global digital payments platform enabling online payments, peer-to-peer transfers, and merchant payment processing.
PYPL Technical Analysis Summary
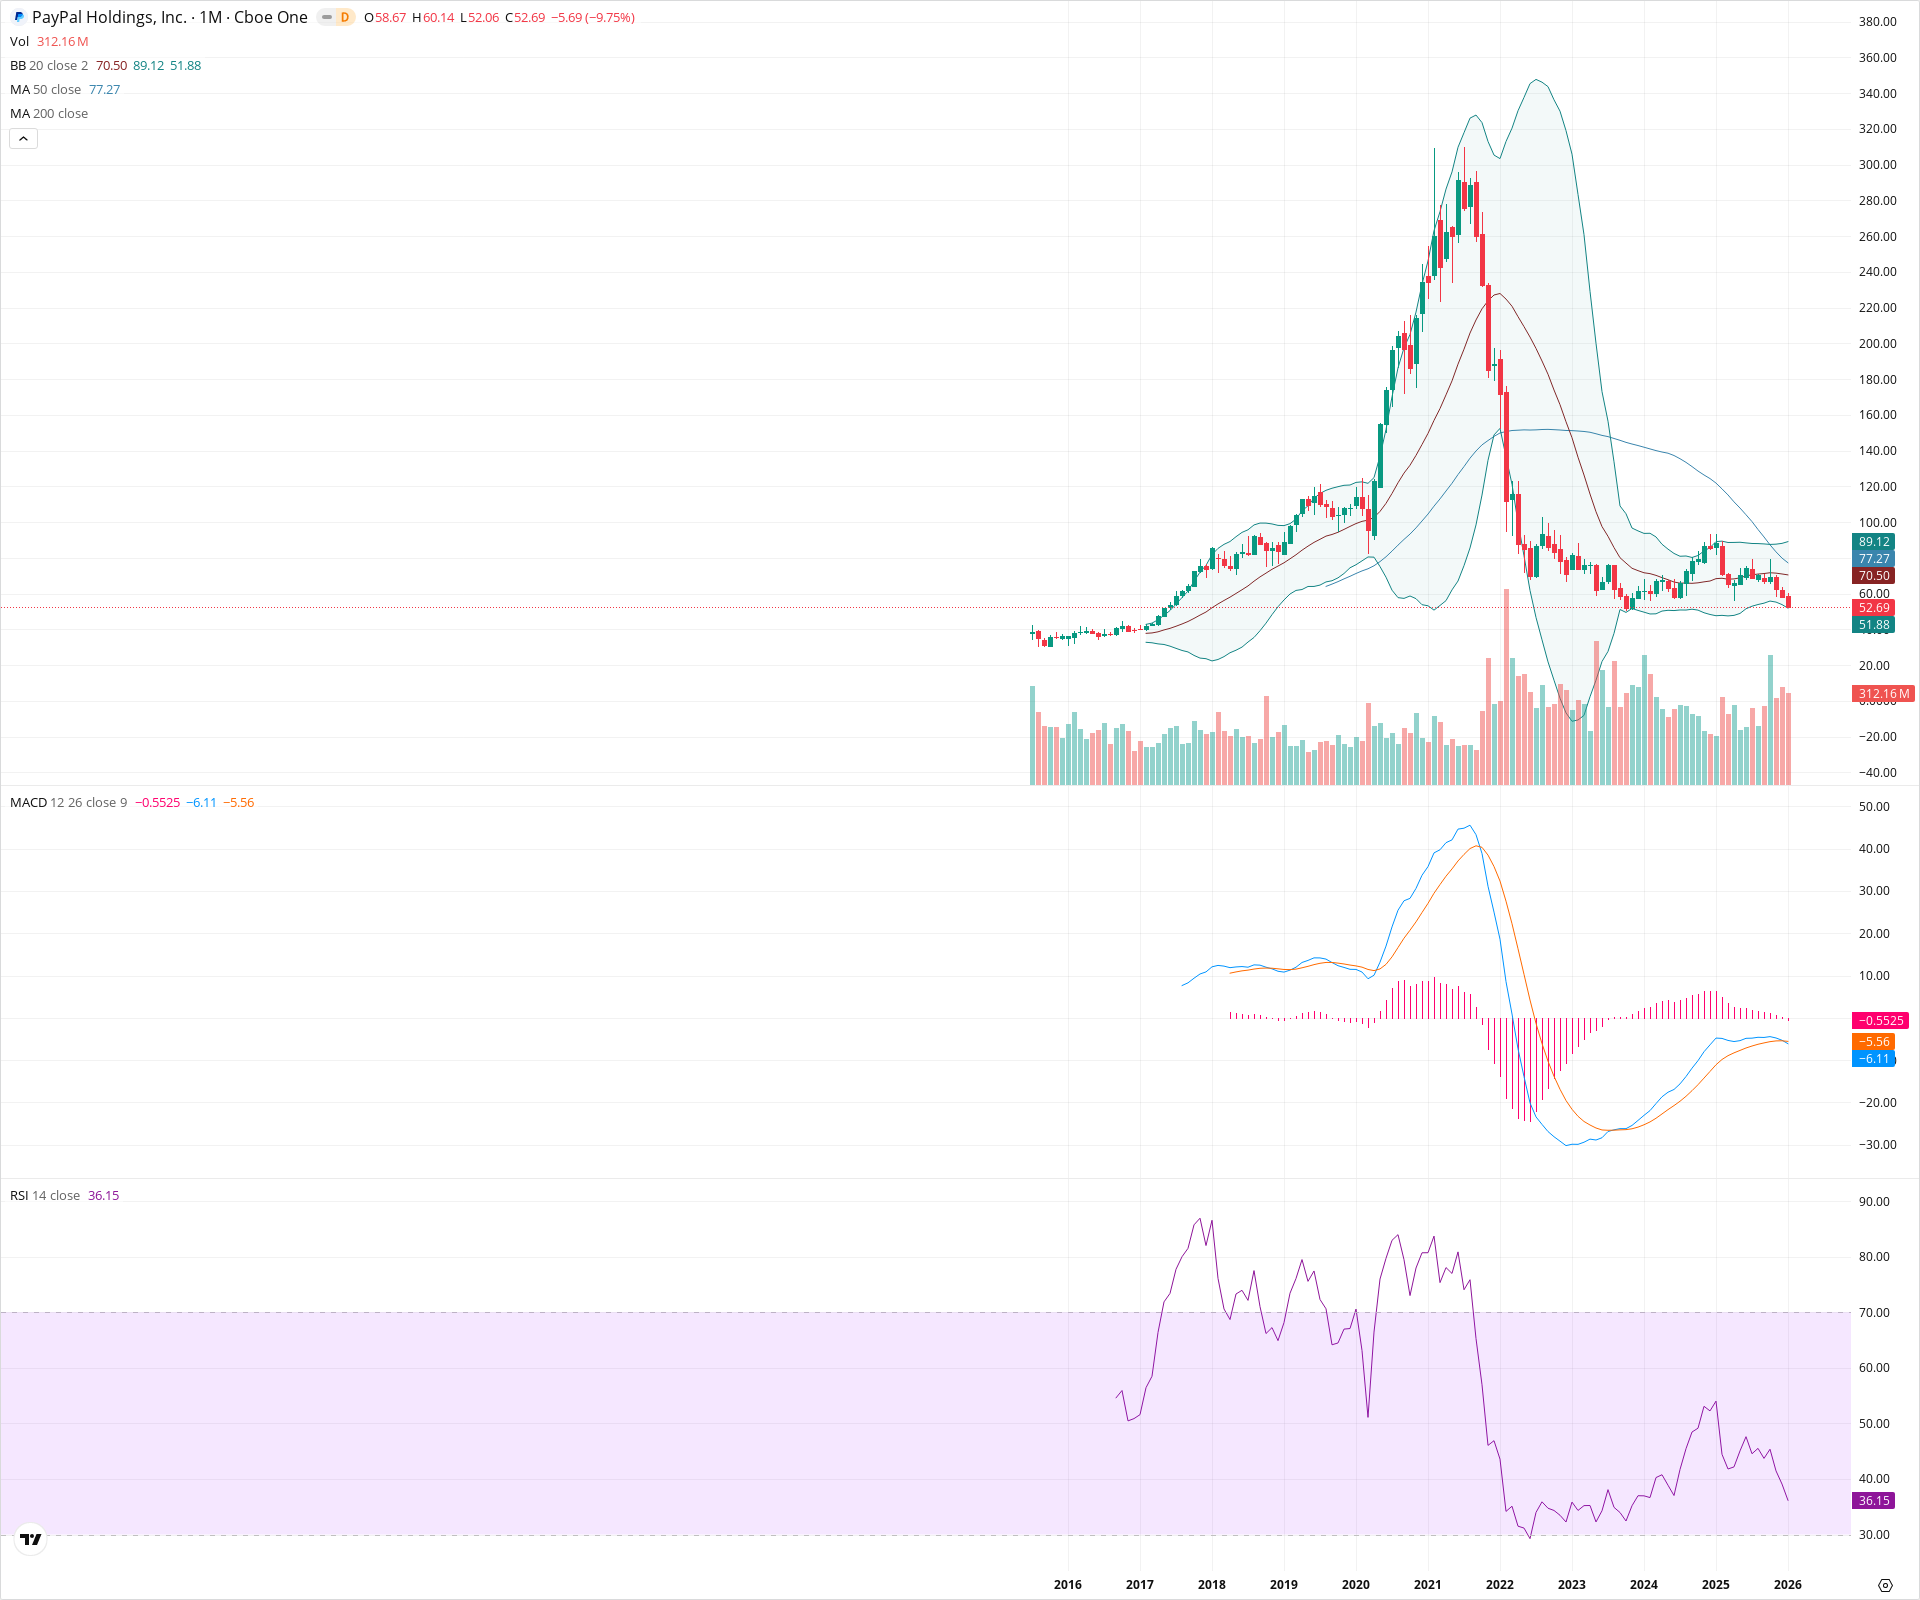
PayPal is trading within a prolonged bearish consolidation structure, characterized by a descending triangle with a clear support floor near $50. The price remains suppressed below key long-term moving averages (20 and 50 SMAs), and the MACD histogram has recently flipped negative, suggesting renewed downside pressure. A failure to hold the $50 support level would likely trigger a continuation of the secular downtrend, while a reclaim of the $77 level is required to confirm a structural reversal.
Included In Lists
Related Tickers of Interest
PYPL Monthly Chart
Sentiment
Short-term Sentiment (days to weeks): Bearish
The current month shows a sharp decline of nearly 10%, rejecting recent consolidation highs and pushing price back towards critical support near the lower Bollinger Band.
Long-term Sentiment (weeks to months): Bearish
The stock remains trapped below the 20-month and 50-month SMAs, with the RSI staying in bearish territory (<40), indicating a lack of secular recovery momentum.
Report Metadata
- Timeframe: monthly
- Generated at: 2026-02-02T06:56:55.082Z
- Model: gemini-3-pro-preview
Support Price Levels
| Level | Range | Strength | Notes |
|---|---|---|---|
| $51.00 | $50.00 - $52.00 | Strong | Multi-year structural lows and current lower Bollinger Band alignment. |
| $40.00 | $38.00 - $42.00 | Weak | Historical accumulation zone from 2017 pre-breakout. |
Resistance Price Levels
| Level | Range | Strength | Notes |
|---|---|---|---|
| $70.50 | $70.00 - $71.00 | Strong | 20-month SMA and recent swing high resistance. |
| $77.50 | $77.00 - $78.00 | Strong | 50-month SMA acting as the major trend cap. |
Potential Chart Patterns in Formation
| Strength | Pattern | Signal | Target | Details |
|---|---|---|---|---|
| Strong | Descending Triangle | Bearish | N/A | A bearish consolidation structure defined by a flat support floor around $50 and a series of declining swing highs since 2022. |
Frequently Asked Questions about PYPL
What is the current sentiment for PYPL?
The short-term sentiment for PYPL is currently Bearish because The current month shows a sharp decline of nearly 10%, rejecting recent consolidation highs and pushing price back towards critical support near the lower Bollinger Band.. The long-term trend is classified as Bearish.
What are the key support levels for PYPL?
StockDips.AI has identified key support levels for PYPL at $51.00 and $40.00. These levels may represent potential accumulation zones where buying interest could emerge.
Is PYPL in a significant dip or a Value Dip right now?
PYPL has a Value Score of 56/100. It is not currently flagged as a significant dip in the Top Dips list. It is not listed as a Value Dip because the long-term sentiment or value-score threshold does not qualify.
View the full interactive analysis on StockDips.AI.