PYPL Daily Technical Analysis
PayPal Holdings, Inc.
Leading global digital payments platform enabling online payments, peer-to-peer transfers, and merchant payment processing.
PYPL Technical Analysis Summary
PYPL has undergone a significant technical shift, breaking out of a long-term base on massive volume and clearing the 200-day SMA. This strongly implies a long-term trend reversal to the upside. In the short term, however, the stock is stretched and overbought, currently digesting its rapid gains; holding support above the 52.50 area will be key for maintaining bullish conviction.
Included In Lists
Related Tickers of Interest
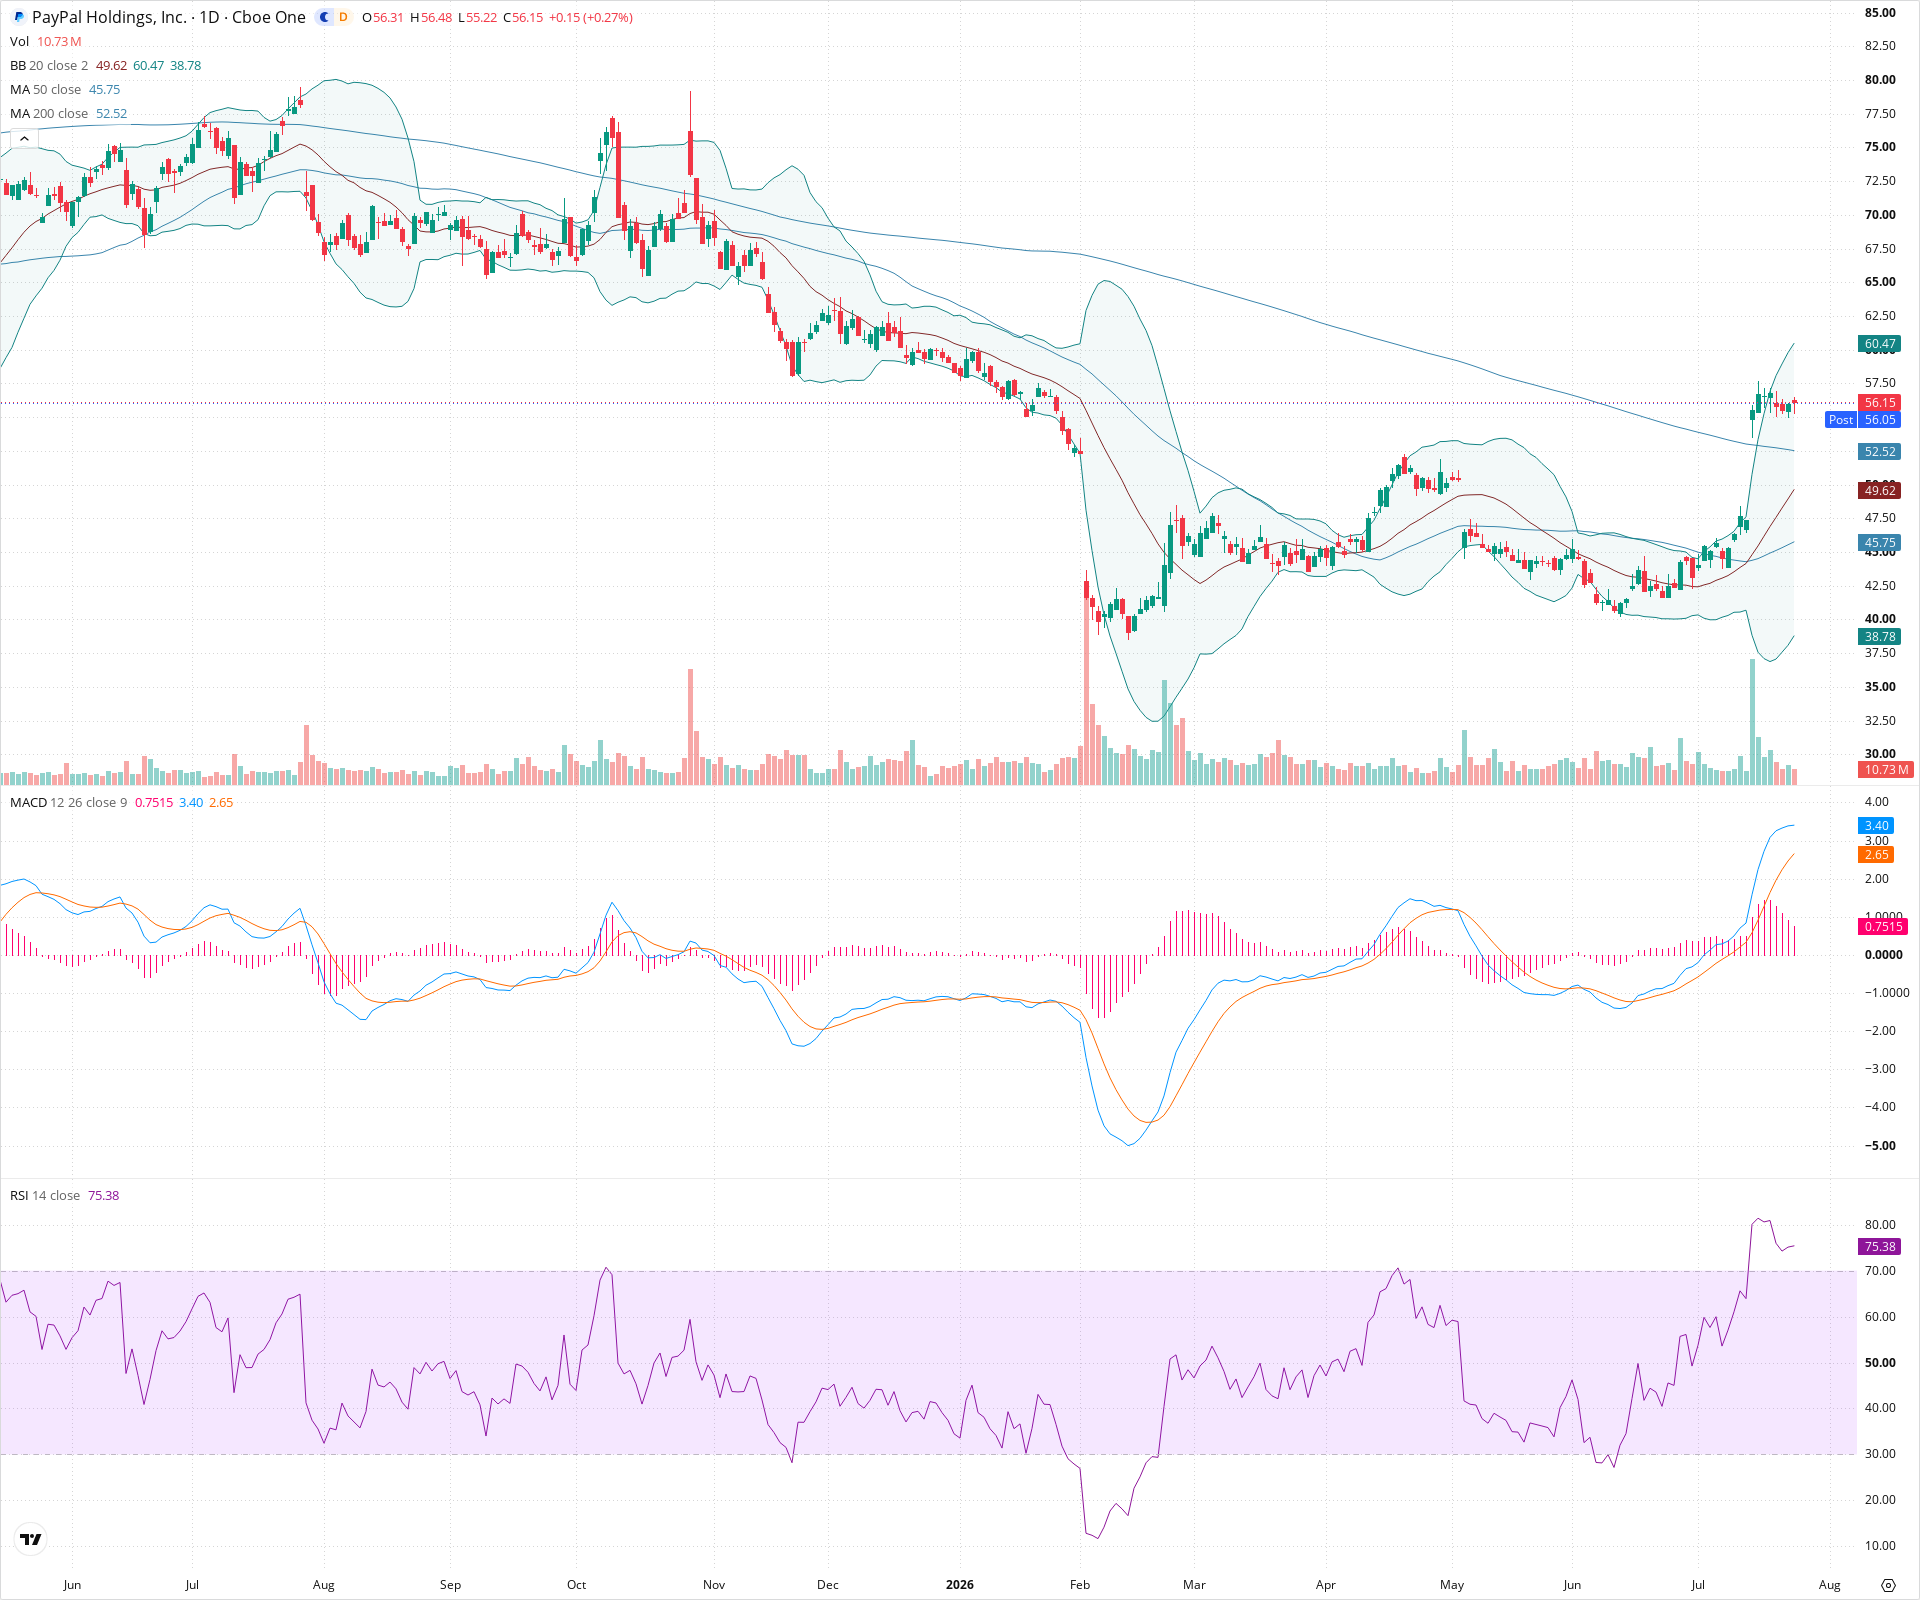
PYPL Daily Chart
Sentiment
Short-term Sentiment (days to weeks): Neutral
Despite strong recent upward momentum, the RSI is highly overbought (above 75) and the last few daily candles show a pullback, suggesting a near-term pause or consolidation before further direction is established.
Long-term Sentiment (weeks to months): Bullish
The price has decisively broken above the 200-day SMA on massive volume, signaling a potential long-term trend reversal. The 50-day SMA is curling upward, and the MACD is in strong positive territory.
Report Metadata
- Timeframe: daily
- Generated at: 2026-07-24T21:16:36.799Z
- Model: gemini-3.1-pro-preview
Support Price Levels
| Level | Range | Strength | Notes |
|---|---|---|---|
| $52.50 | $52.00 - $53.00 | Strong | Aligns with the 200-day SMA and recent consolidation support after the breakout. |
| $49.50 | $48.50 - $50.50 | Moderate | Top of the previous gap zone and currently aligns with the rising 20-day SMA. |
| $44.50 | $43.00 - $46.00 | Strong | The foundational base prior to the massive volume breakout, now reinforced by the 50-day SMA. |
Resistance Price Levels
| Level | Range | Strength | Notes |
|---|---|---|---|
| $60.75 | $60.00 - $61.50 | Strong | Recent swing high established after the parabolic run; visible upper wicks indicate selling pressure here. |
| $66.25 | $65.00 - $67.50 | Moderate | Historical consolidation area from the previous downtrend on the left side of the chart. |
| $76.25 | $75.00 - $77.50 | Strong | Major prior swing high and resistance block before a significant leg down. |
Potential Chart Patterns in Formation
| Strength | Pattern | Signal | Target | Details |
|---|---|---|---|---|
| Strong | Volume Breakout / Gap Up | Bullish | N/A | A massive surge in volume accompanied by a large gap up, breaking the stock out of a prolonged basing period. |
| Weak | Bull Flag (Forming) | Bullish | $65.00 | After a steep upward 'flagpole' move, the price is currently forming a tight downward-sloping consolidation channel. |
Frequently Asked Questions about PYPL
What is the current sentiment for PYPL?
The short-term sentiment for PYPL is currently Neutral because Despite strong recent upward momentum, the RSI is highly overbought (above 75) and the last few daily candles show a pullback, suggesting a near-term pause or consolidation before further direction is established.. The long-term trend is classified as Bullish.
What are the key support levels for PYPL?
StockDips.AI has identified key support levels for PYPL at $52.50 and $49.50. These levels may represent potential accumulation zones where buying interest could emerge.
Is PYPL in a significant dip or a Value Dip right now?
PYPL has a Value Score of 56/100. It is not currently flagged as a significant dip in the Top Dips list. It is not listed as a Value Dip because the long-term sentiment or value-score threshold does not qualify.
View the full interactive analysis on StockDips.AI.