QQQ Monthly Technical Analysis
Nasdaq-100 Index (Tech)
Invesco QQQ - Follows the Nasdaq-100 index, heavily weighted toward major technology companies.
QQQ Technical Analysis Summary
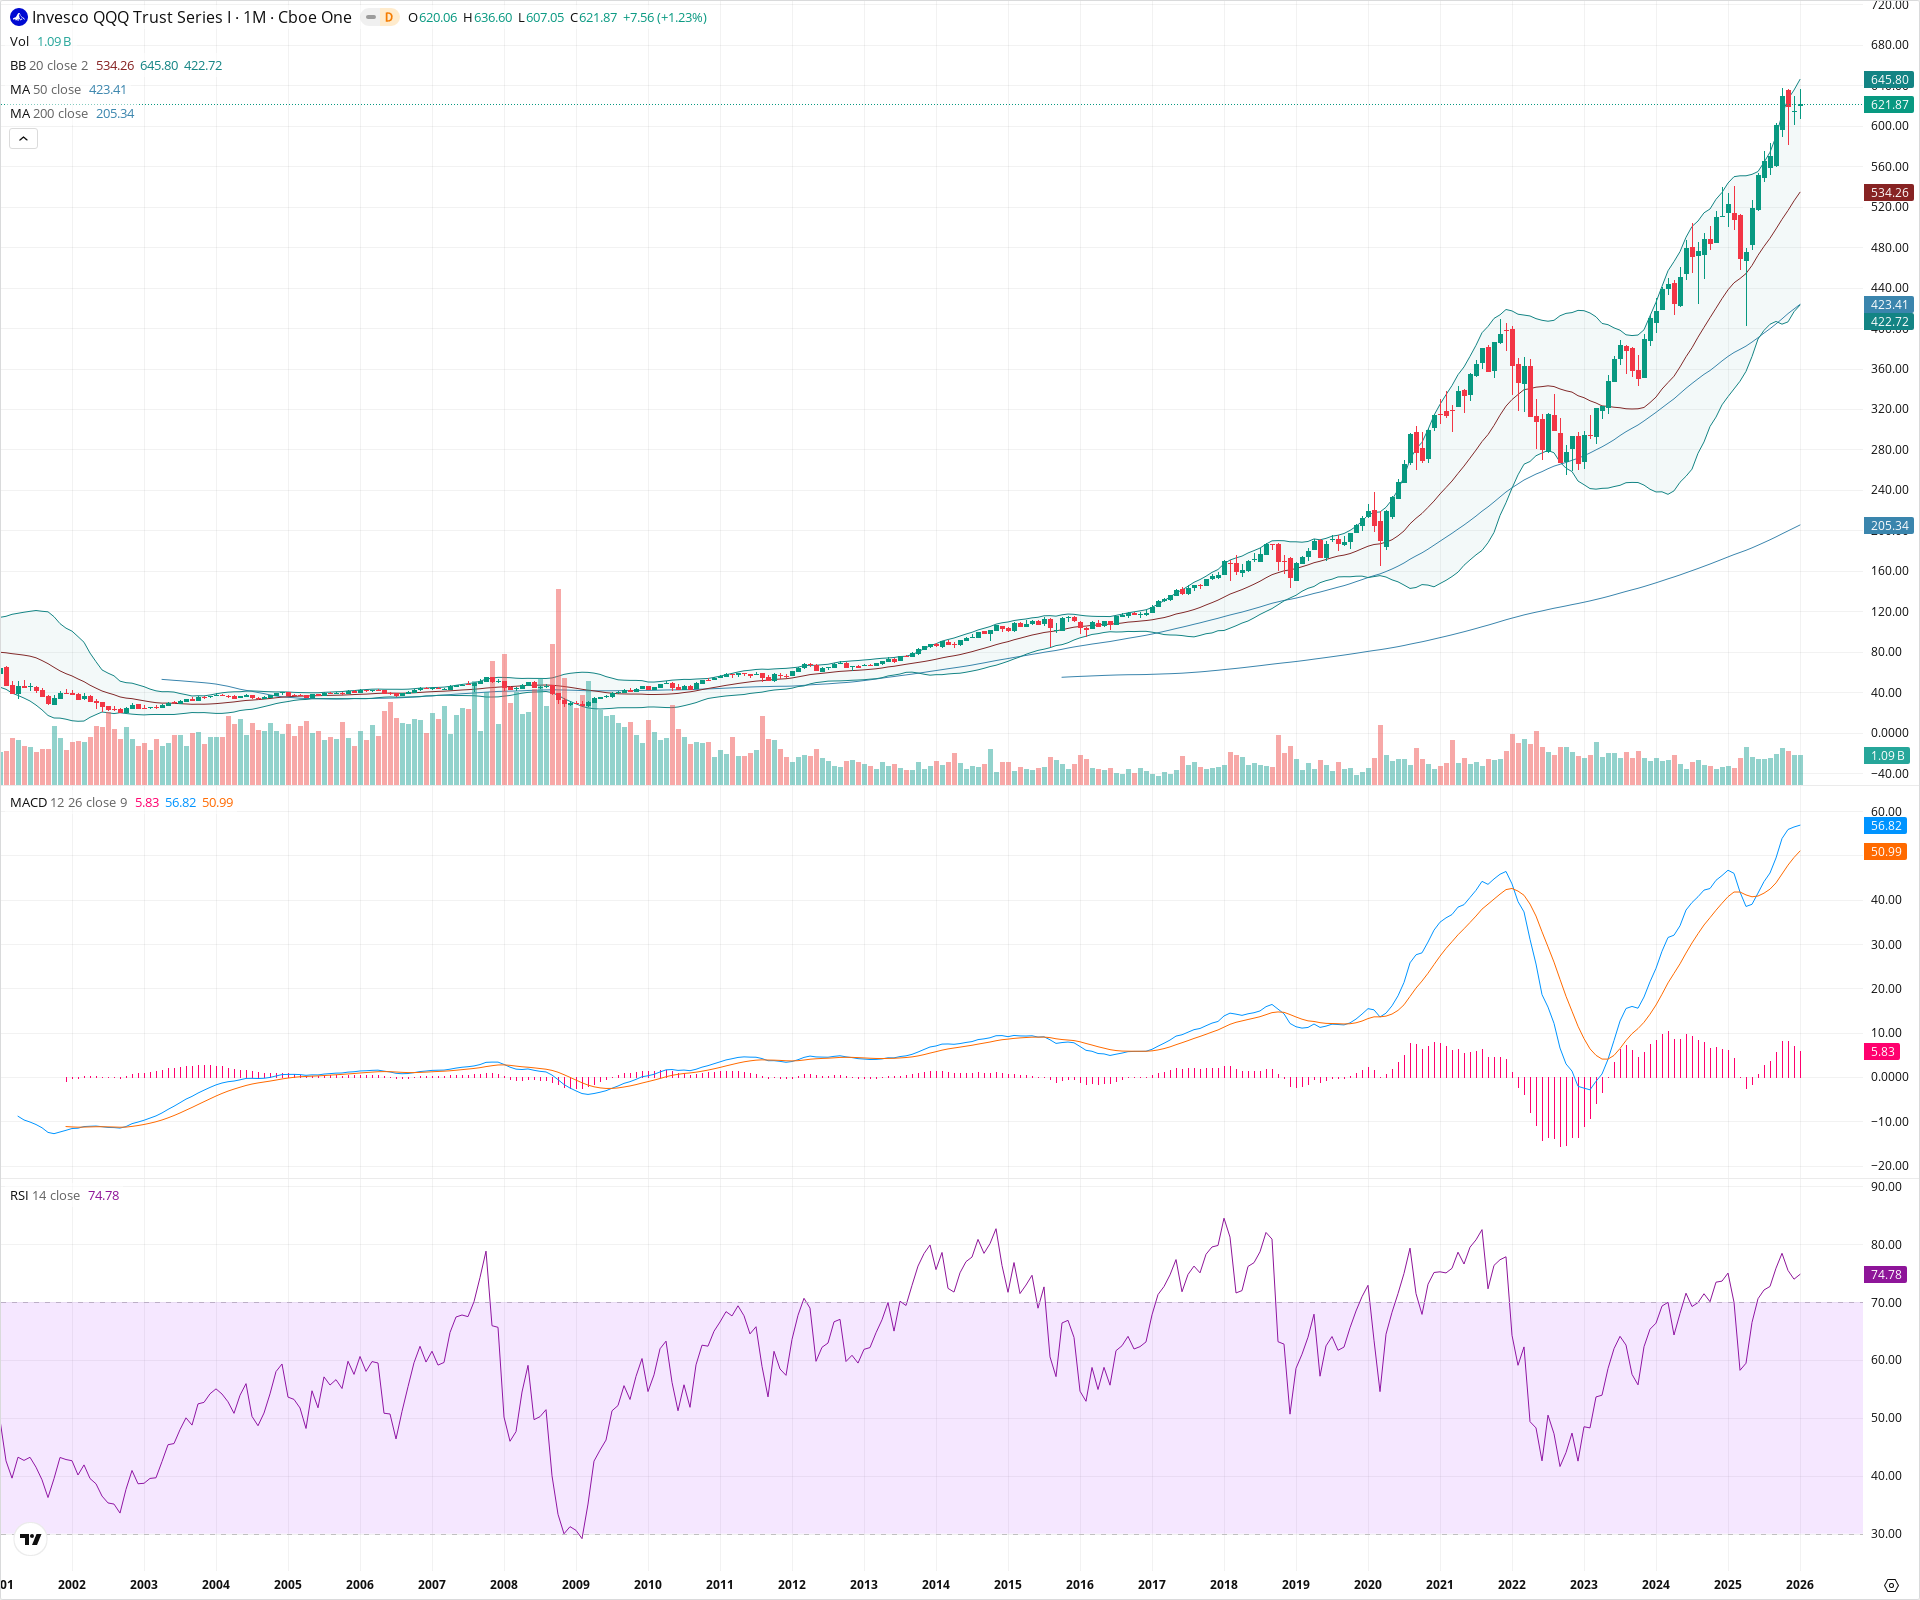
QQQ is in a robust long-term uptrend, trading well above all key moving averages with momentum indicators like MACD confirming the strength of the current advance. The RSI is elevated (>70), reflecting a strong bullish regime rather than immediate exhaustion, as price rides the upper Bollinger Band. While extended, the structural outlook remains highly constructive for long-term investors unless critical support levels near the 20-month SMA fail.
Included In Lists
Related Tickers of Interest
QQQ Monthly Chart
Sentiment
Short-term Sentiment (days to weeks): Bullish
Price is trading near all-time highs with the most recent monthly candle showing continued upward momentum. The MACD histogram remains positive and expanding, indicating strength in the immediate trend.
Long-term Sentiment (weeks to months): Bullish
The chart exhibits a powerful secular uptrend with perfect bullish alignment of the 20, 50, and 200-month SMAs. The price successfully broke out of the 2022 correction structure and has extended significantly beyond previous highs.
Report Metadata
- Timeframe: monthly
- Generated at: 2026-02-02T04:03:32.192Z
- Model: gemini-3-pro-preview
Support Price Levels
| Level | Range | Strength | Notes |
|---|---|---|---|
| $535.00 | $530.00 - $540.00 | Strong | Aligns with the rising 20-month SMA and recent consolidation zones before the latest vertical leg. |
| $405.00 | $400.00 - $410.00 | Strong | Major structural breakout level corresponding to the 2021 highs; now serves as critical long-term floor. |
Resistance Price Levels
| Level | Range | Strength | Notes |
|---|---|---|---|
| $641.20 | $636.60 - $645.80 | Weak | Immediate resistance formed by the current all-time high and the upper Bollinger Band. |
Potential Chart Patterns in Formation
| Strength | Pattern | Signal | Target | Details |
|---|---|---|---|---|
| Strong | Secular Bull Trend | Bullish | N/A | A multi-year channel of higher highs and higher lows, characterized by price consistently riding above the 20-month and 50-month moving averages. |
| Strong | V-Shape Recovery / Breakout | Bullish | N/A | Full recovery from the 2022 correction (lows ~260) leading to a decisive breakout above the 400 level in late 2023/early 2024. |
Frequently Asked Questions about QQQ
What is the current sentiment for QQQ?
The short-term sentiment for QQQ is currently Bullish because Price is trading near all-time highs with the most recent monthly candle showing continued upward momentum. The MACD histogram remains positive and expanding, indicating strength in the immediate trend.. The long-term trend is classified as Bullish.
What are the key support levels for QQQ?
StockDips.AI has identified key support levels for QQQ at $535.00 and $405.00. These levels may represent potential accumulation zones where buying interest could emerge.
Is QQQ in a significant dip or a Value Dip right now?
QQQ has a Value Score of 82/100. It is currently flagged as a significant dip in the Top Dips list. It is also listed as a Value Dip because long-term sentiment is bullish.
View the full interactive analysis on StockDips.AI.