QURE Monthly Technical Analysis
uniQure N.V.
Biotechnology company that focuses on developing innovative gene therapies for patients with rare and devastating diseases.
QURE Technical Analysis Summary
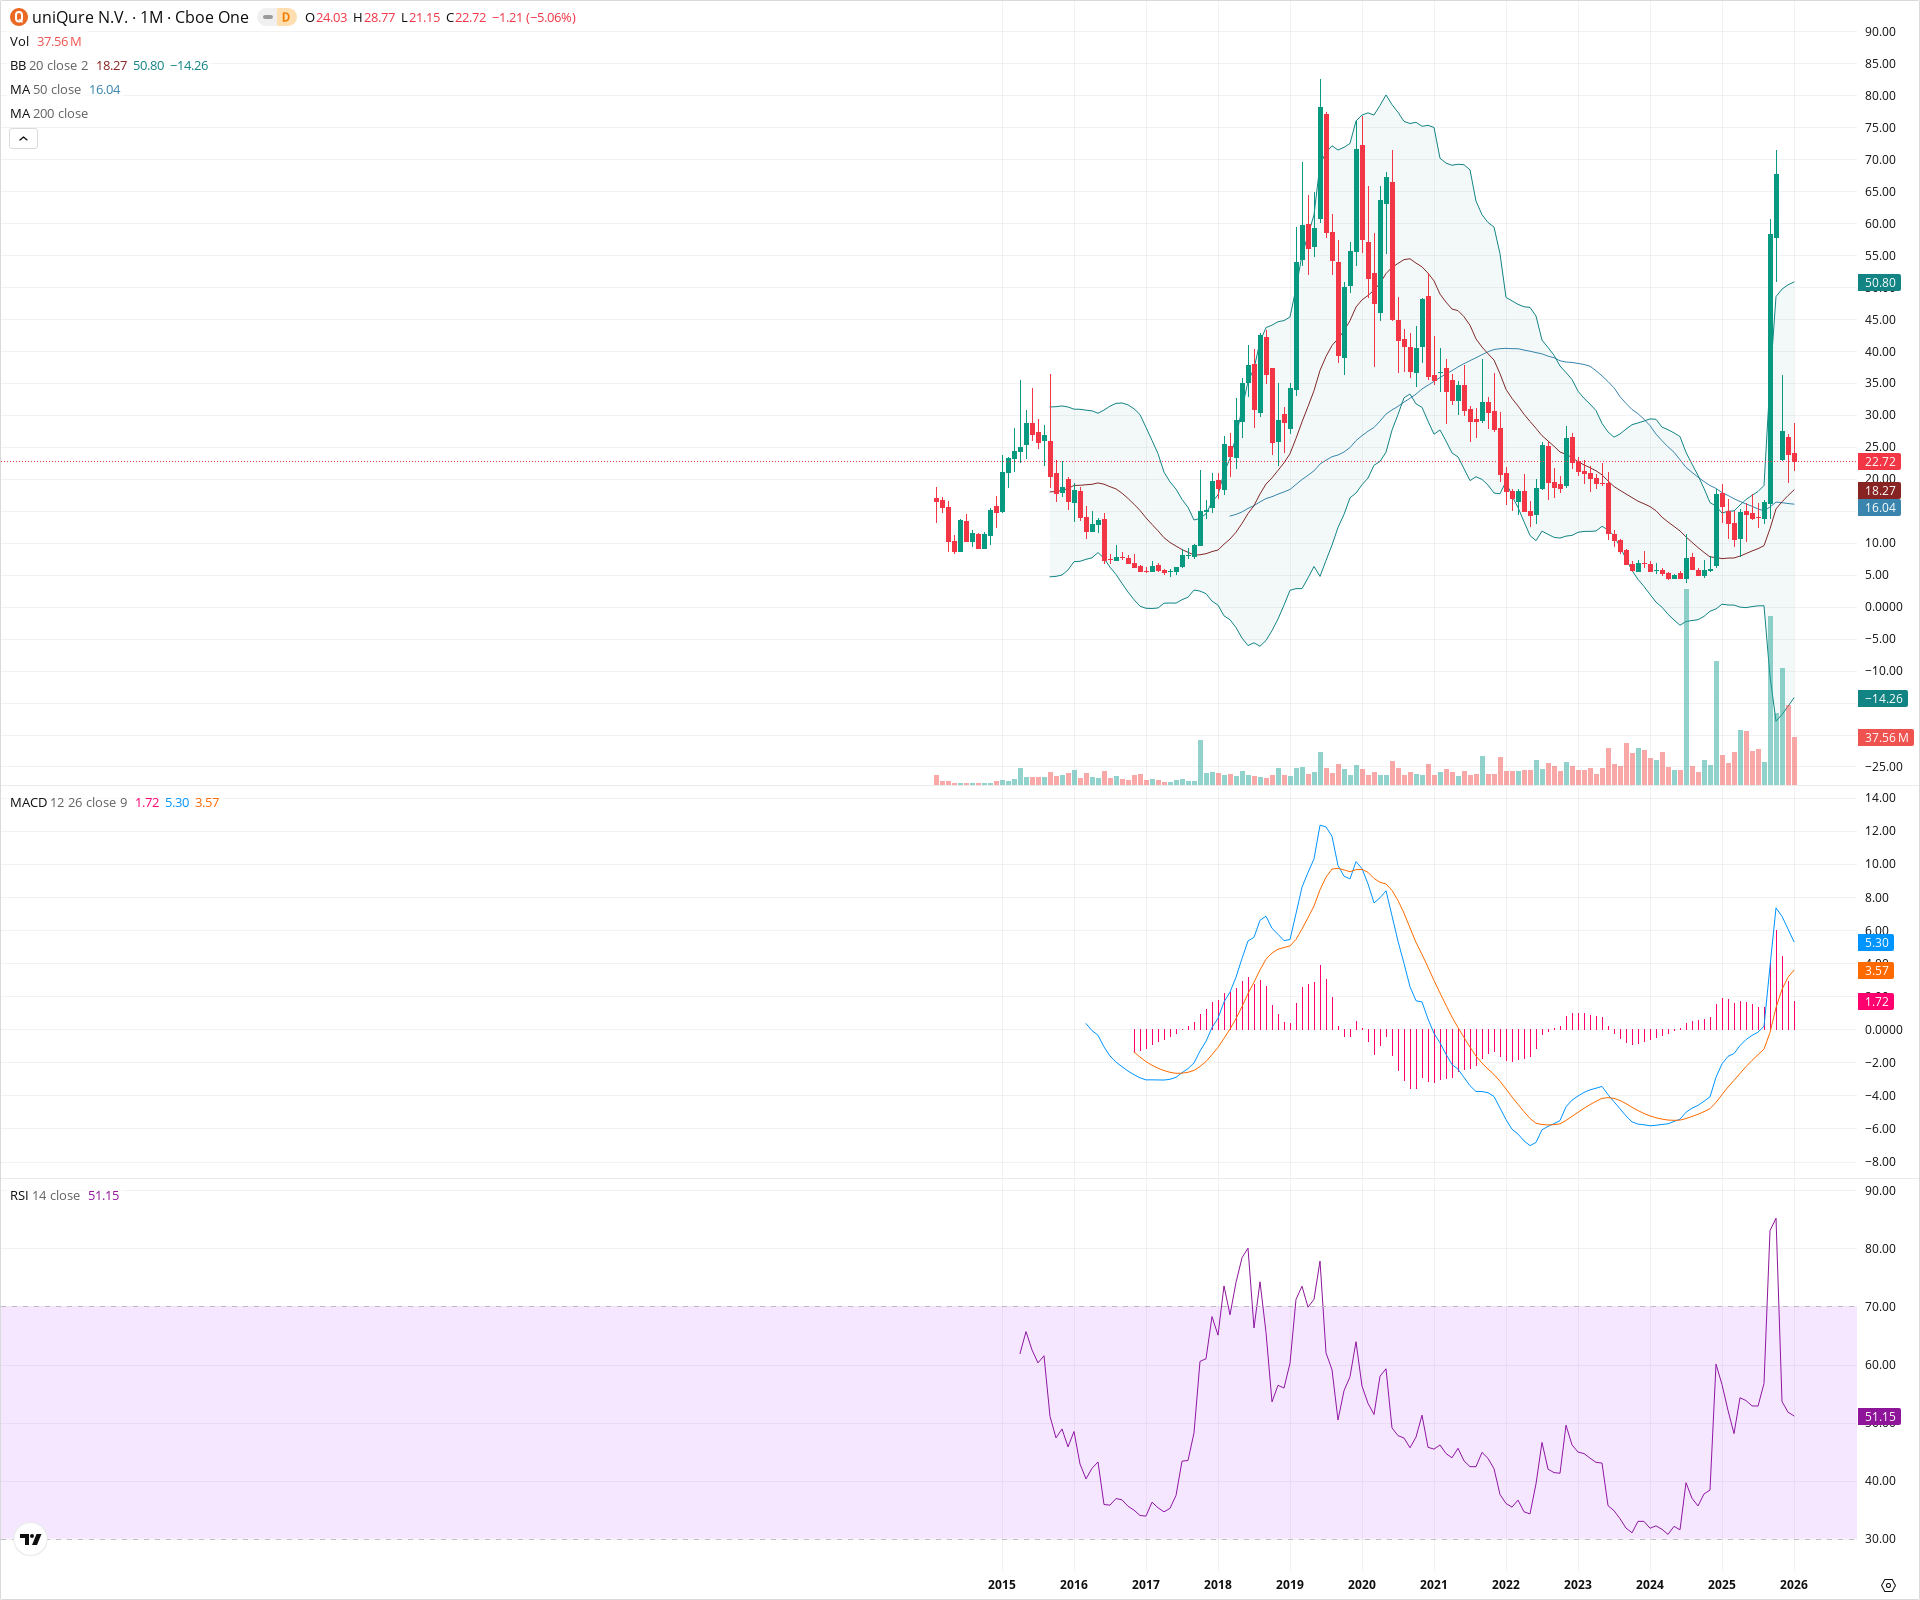
uniQure N.V. is in a volatile transitional phase following a breakout from a major multi-year base. After an extreme volume-driven spike to historical highs, the price has mean-reverted to test the breakout zone and the rising 20-month and 50-month moving averages. The long-term technical picture remains constructive as long as the 16.00–18.30 support zone holds, supported by a bullish MACD regime above the zero line.
Included In Lists
Related Tickers of Interest
QURE Monthly Chart
Sentiment
Short-term Sentiment (days to weeks): Neutral
The stock has sharply retraced from recent volatility spikes and is currently consolidating. It is testing critical support at the 20-month SMA and 50-month SMA, requiring a hold here to avoid further downside.
Long-term Sentiment (weeks to months): Bullish
Price has structurally broken out of a multi-year base (2021–2023). Despite the recent pullback, the stock remains above the rising 20-month and 50-month moving averages, and the monthly MACD maintains a bullish configuration above the zero line.
Report Metadata
- Timeframe: monthly
- Generated at: 2026-02-02T06:57:22.093Z
- Model: gemini-3-pro-preview
Support Price Levels
| Level | Range | Strength | Notes |
|---|---|---|---|
| $17.13 | $16.00 - $18.27 | Strong | Critical confluence zone of the 50-month SMA (16.04) and the 20-month SMA/Bollinger Band basis (18.27). |
| $6.25 | $4.50 - $8.00 | Strong | Secular lows and multi-year accumulation base formed between 2022 and 2024. |
Resistance Price Levels
| Level | Range | Strength | Notes |
|---|---|---|---|
| $38.50 | $35.00 - $42.00 | Weak | Zone of previous consolidation during the 2020-2021 period. |
| $85.00 | $80.00 - $90.00 | Strong | Historical highs from 2019 and the peak of the recent extreme volatility wick. |
Potential Chart Patterns in Formation
| Strength | Pattern | Signal | Target | Details |
|---|---|---|---|---|
| Strong | Rounding Bottom Breakout & Retest | Bullish | N/A | A clear multi-year rounding bottom formed from 2021 to 2023. The price recently broke out on massive volume and is now performing a 'throwback' or retest of the breakout level and moving averages. |
Frequently Asked Questions about QURE
What is the current sentiment for QURE?
The short-term sentiment for QURE is currently Neutral because The stock has sharply retraced from recent volatility spikes and is currently consolidating. It is testing critical support at the 20-month SMA and 50-month SMA, requiring a hold here to avoid further downside.. The long-term trend is classified as Bullish.
What are the key support levels for QURE?
StockDips.AI has identified key support levels for QURE at $17.13 and $6.25. These levels may represent potential accumulation zones where buying interest could emerge.
Is QURE in a significant dip or a Value Dip right now?
QURE has a Value Score of 78/100. It is currently flagged as a significant dip in the Top Dips list. It is also listed as a Value Dip because long-term sentiment is bullish.
View the full interactive analysis on StockDips.AI.