SNOW Monthly Technical Analysis
Snowflake Inc
Cloud data platform for storing and analyzing data across providers.
SNOW Technical Analysis Summary
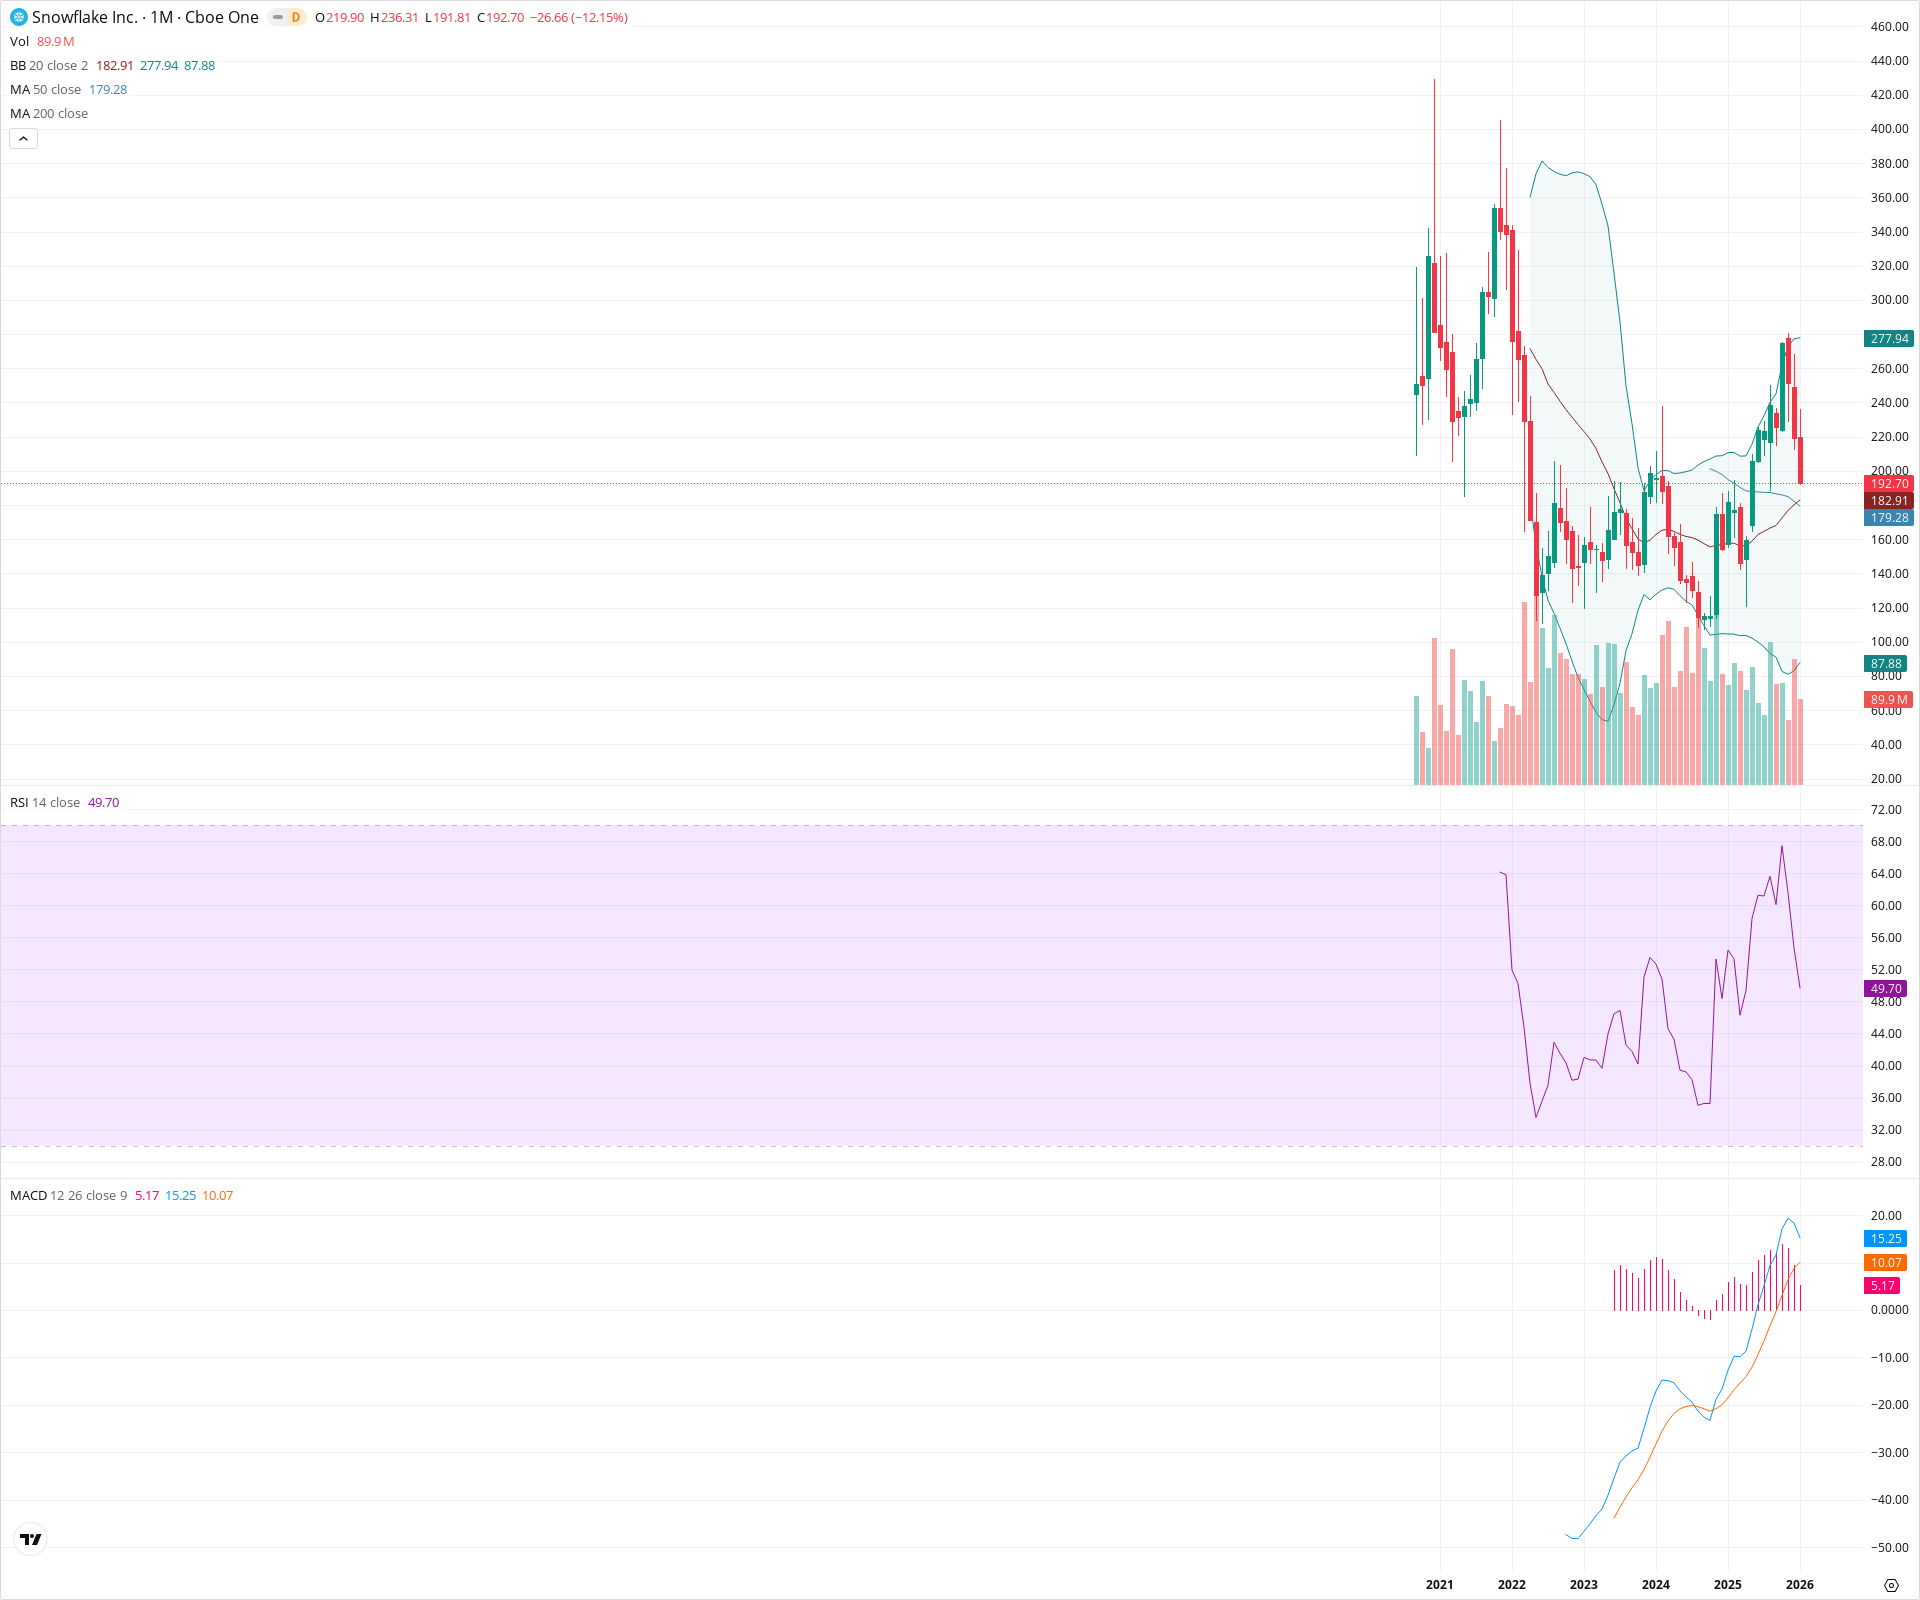
Snowflake is in a long-term transitional phase, forming a large rounding bottom structure that suggests secular accumulation. While the long-term indicators like the MACD and 50-month SMA support a bullish regime change, the immediate price action is testing critical support around the 180 level following a sharp rejection from 236. Investors should watch for stabilization near the moving averages to confirm the durability of the recent breakout trend.
Included In Lists
Related Tickers of Interest
SNOW Monthly Chart
Sentiment
Short-term Sentiment (days to weeks): Neutral
Price is experiencing a sharp pullback (-12.15%) from recent highs, testing the breakout zone, though the medium-term uptrend structure remains technically intact.
Long-term Sentiment (weeks to months): Bullish
A multi-year rounding bottom pattern has established higher lows, supported by a rising 50-month SMA and a bullish MACD crossover above the zero line.
Report Metadata
- Timeframe: monthly
- Generated at: 2026-02-02T06:57:58.330Z
- Model: gemini-3-pro-preview
Support Price Levels
| Level | Range | Strength | Notes |
|---|---|---|---|
| $181.00 | $179.00 - $183.00 | Strong | Confluence of the 20-month SMA (Bollinger Basis) and the rising 50-month SMA. |
| $145.00 | $140.00 - $150.00 | Strong | Major consolidation zone and higher swing low formed in late 2023. |
| $115.00 | $110.00 - $120.00 | Strong | Secular base lows formed in 2022 and early 2023. |
Resistance Price Levels
| Level | Range | Strength | Notes |
|---|---|---|---|
| $238.00 | $236.00 - $240.00 | Strong | Current month's high and rejection level. |
| $277.50 | $275.00 - $280.00 | Weak | Aligns with the Upper Bollinger Band and historical breakdown levels from 2022. |
Potential Chart Patterns in Formation
| Strength | Pattern | Signal | Target | Details |
|---|---|---|---|---|
| Strong | Rounding Bottom | Bullish | $277.00 | A large, multi-year saucer shape indicating a shift from distribution to accumulation, characterized by progressively higher lows since 2022. |
Frequently Asked Questions about SNOW
What is the current sentiment for SNOW?
The short-term sentiment for SNOW is currently Neutral because Price is experiencing a sharp pullback (-12.15%) from recent highs, testing the breakout zone, though the medium-term uptrend structure remains technically intact.. The long-term trend is classified as Bullish.
What are the key support levels for SNOW?
StockDips.AI has identified key support levels for SNOW at $181.00 and $145.00. These levels may represent potential accumulation zones where buying interest could emerge.
Is SNOW in a significant dip or a Value Dip right now?
SNOW has a Value Score of 27/100. It is not currently flagged as a significant dip in the Top Dips list. It is not listed as a Value Dip because the long-term sentiment or value-score threshold does not qualify.
View the full interactive analysis on StockDips.AI.