SPRB Monthly Technical Analysis
Spruce Biosciences Inc
Spruce Biosciences focuses on developing and commercializing novel therapies for rare endocrine and neurological disorders with significant unmet medical needs.
SPRB Technical Analysis Summary
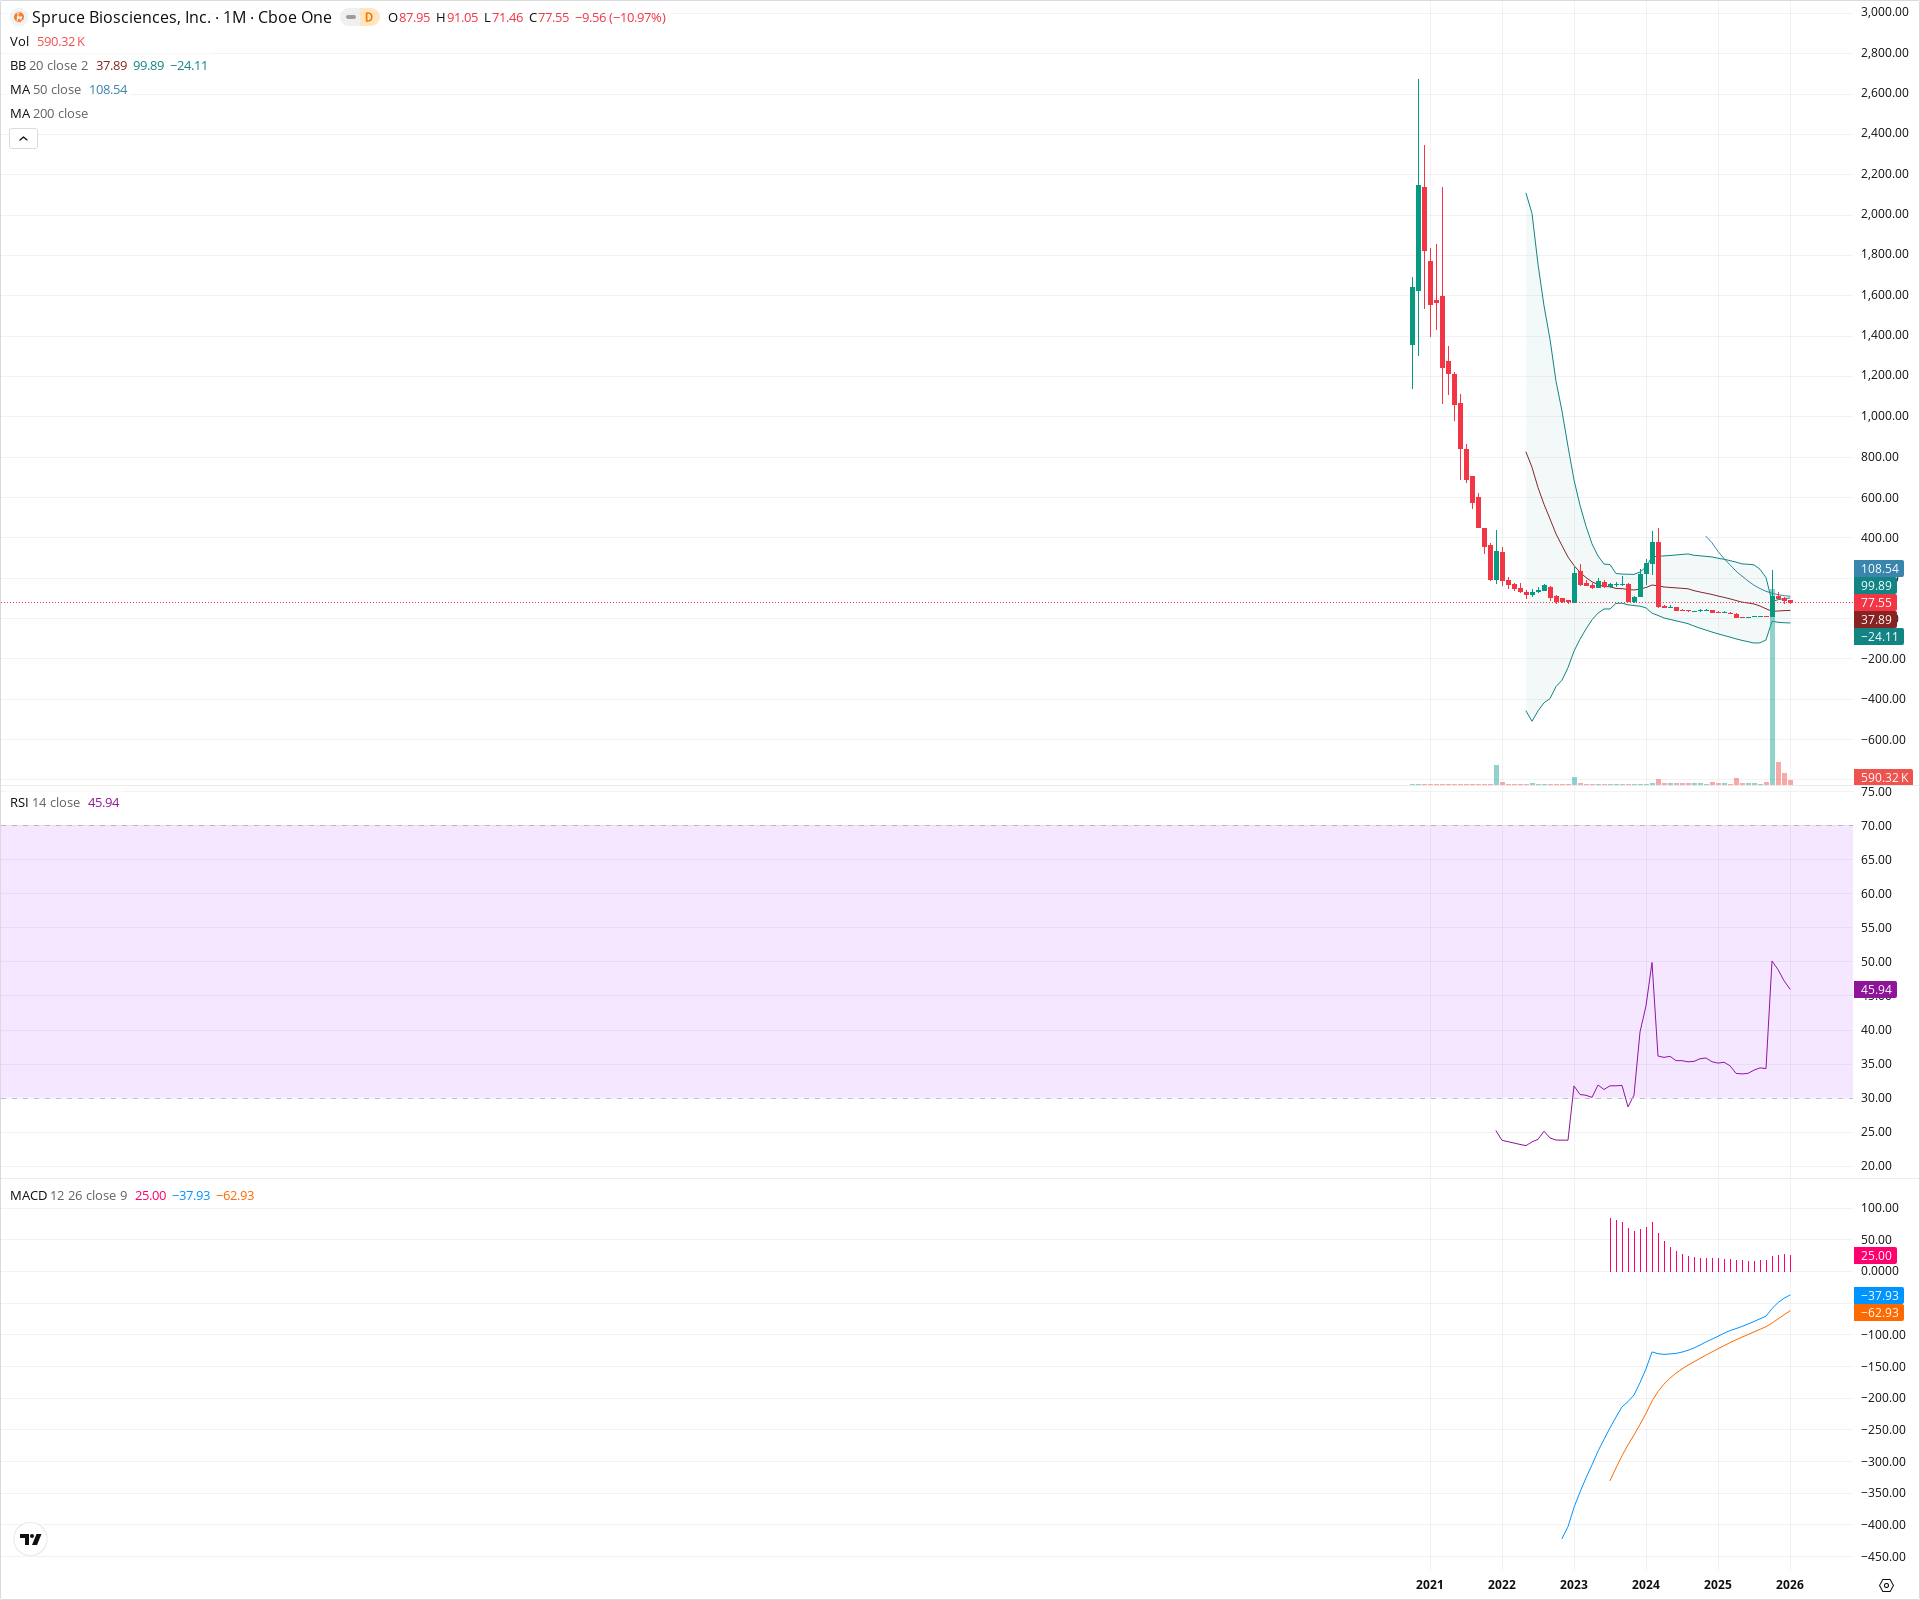
SPRB is currently in a transitional phase, attempting to base after a catastrophic multi-year decline. While the monthly MACD indicates improving momentum and a potential bottoming process, the price structure remains bearish as evidenced by the recent rejection at the 50-month SMA. The stock is trapped between support at the 20-month SMA and strong resistance at the 50-month SMA, requiring a sustained break above 108.54 to signal a true regime change.
Included In Lists
Related Tickers of Interest
SPRB Monthly Chart
Sentiment
Short-term Sentiment (days to weeks): Bearish
The price has been rejected at the 50-month SMA resistance and is down nearly 11% this month with a red candle, indicating immediate selling pressure following a failed breakout attempt.
Long-term Sentiment (weeks to months): Bearish
The stock remains in a severe secular downtrend, trading over 95% below its all-time highs. It has failed to reclaim the 50-month SMA, which acts as a dynamic cap on the price, despite a stabilizing MACD.
Report Metadata
- Timeframe: monthly
- Generated at: 2026-02-02T06:58:25.012Z
- Model: gemini-3-pro-preview
Support Price Levels
| Level | Range | Strength | Notes |
|---|---|---|---|
| $38.95 | $37.89 - $40.00 | Weak | Aligns with the 20-month SMA (37.89) which currently sits below the price. |
| $21.50 | $18.00 - $25.00 | Strong | Historical all-time low zone established during the 2022-2023 consolidation phase. |
Resistance Price Levels
| Level | Range | Strength | Notes |
|---|---|---|---|
| $111.77 | $108.54 - $115.00 | Strong | The 50-month SMA (108.54) is the primary overhead resistance which recently rejected the price advance. |
| $375.00 | $350.00 - $400.00 | Weak | Approximate top of the recent volatility spike/wick visible in late 2023/early 2024. |
Potential Chart Patterns in Formation
| Strength | Pattern | Signal | Target | Details |
|---|---|---|---|---|
| Moderate | Long-term Base / Consolidation | Neutral | N/A | After a massive decline from 2021 highs, the price has been moving sideways in a narrow range for over two years, attempting to find a floor. |
| Moderate | Bullish MACD Crossover | Bullish | N/A | The monthly MACD line has crossed above the Signal line and is rising towards zero, accompanied by a positive histogram, suggesting long-term momentum is shifting away from extreme bearishness. |
Frequently Asked Questions about SPRB
What is the current sentiment for SPRB?
The short-term sentiment for SPRB is currently Bearish because The price has been rejected at the 50-month SMA resistance and is down nearly 11% this month with a red candle, indicating immediate selling pressure following a failed breakout attempt.. The long-term trend is classified as Bearish.
What are the key support levels for SPRB?
StockDips.AI has identified key support levels for SPRB at $38.95 and $21.50. These levels may represent potential accumulation zones where buying interest could emerge.
Is SPRB in a significant dip or a Value Dip right now?
SPRB has a Value Score of 74/100. It is currently flagged as a significant dip in the Top Dips list. It is not listed as a Value Dip because the long-term sentiment or value-score threshold does not qualify.
View the full interactive analysis on StockDips.AI.