SPY Monthly Technical Analysis
S&P 500 Index
SPDR S&P 500 ETF - Tracks the S&P 500 index of the largest U.S. companies and serves as a core benchmark for the U.S. market.
SPY Technical Analysis Summary
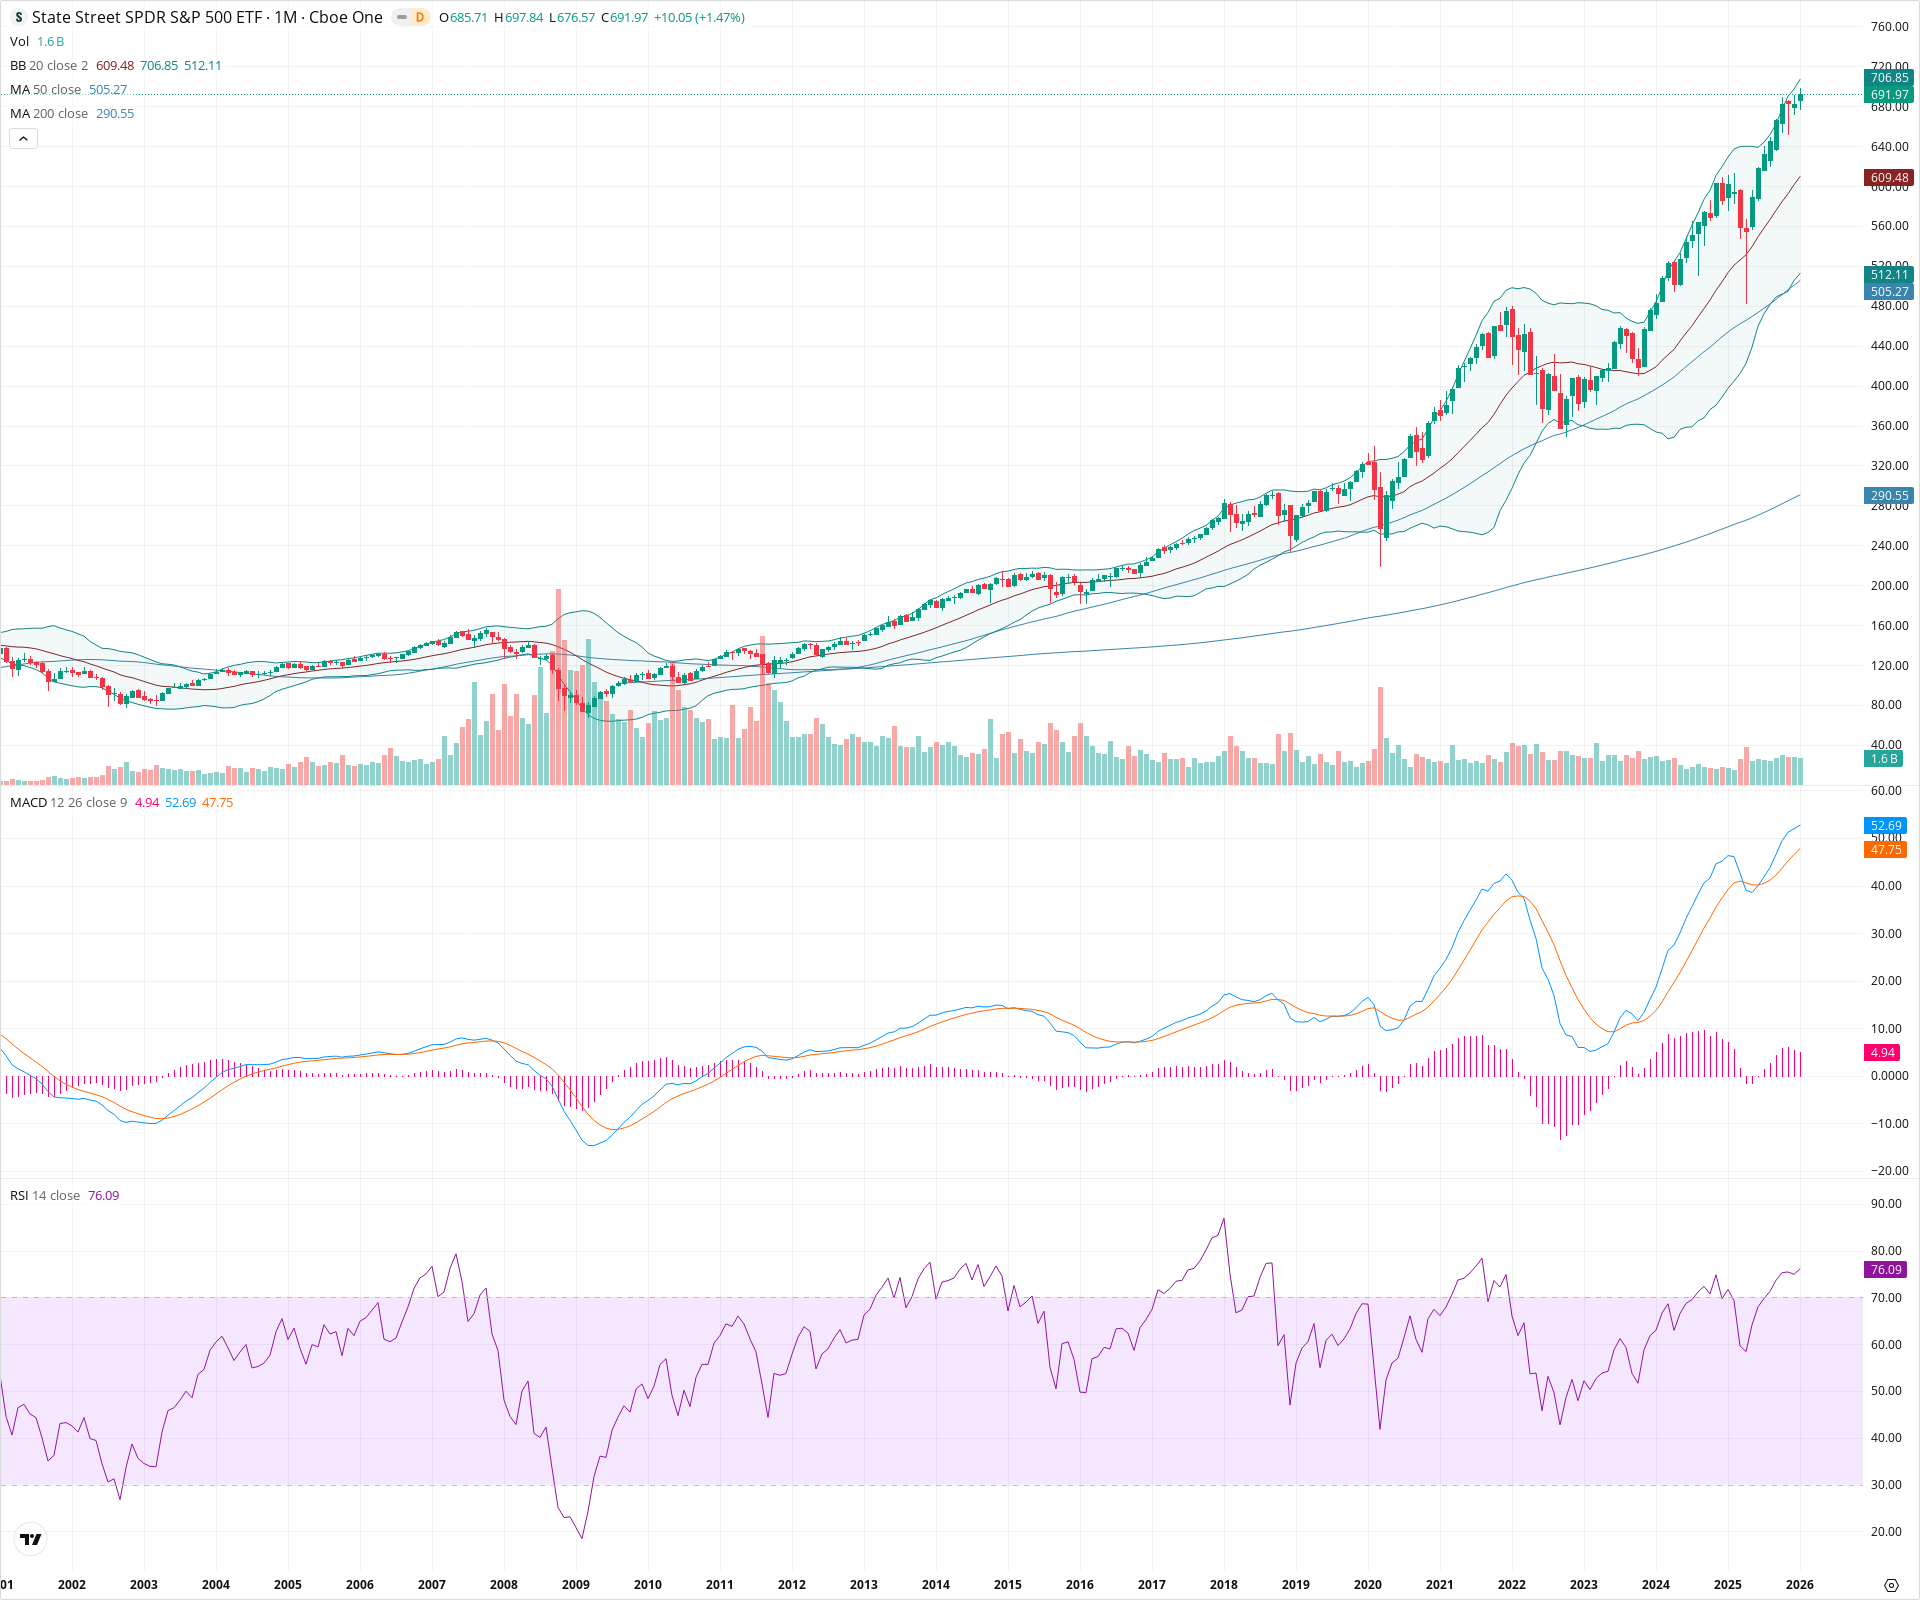
SPY is in a powerful secular bull market, evidenced by a steep ascending price channel and moving averages that are fanning out in bullish alignment. Momentum indicators like the MACD and RSI are elevated, confirming trend strength rather than exhaustion on the monthly timeframe. While price is extended near the upper Bollinger Band, the primary trend remains strictly upward with major structural support established firmly at the breakout zone near 480-500.
Included In Lists
Related Tickers of Interest
SPY Monthly Chart
Sentiment
Short-term Sentiment (days to weeks): Bullish
Price is trading near all-time highs and riding the upper Bollinger Band, indicating strong momentum. The RSI is above 70, confirming a powerful trend rather than an immediate reversal signal in this timeframe.
Long-term Sentiment (weeks to months): Bullish
The chart exhibits a robust secular uptrend with perfect alignment of the 20, 50, and 200-month SMAs. The MACD has recently confirmed a bullish crossover well above the zero line, signaling sustained long-term momentum.
Report Metadata
- Timeframe: monthly
- Generated at: 2026-02-02T04:09:11.212Z
- Model: gemini-3-pro-preview
Support Price Levels
| Level | Range | Strength | Notes |
|---|---|---|---|
| $605.00 | $600.00 - $610.00 | Weak | Dynamic support provided by the rising 20-month SMA (currently ~609) and recent price consolidation areas. |
| $490.00 | $480.00 - $500.00 | Strong | Major structural support zone representing the breakout level from the 2021 highs and the 50-month SMA. |
| $350.00 | $340.00 - $360.00 | Strong | Significant secular floor established during the 2022 correction lows. |
Resistance Price Levels
| Level | Range | Strength | Notes |
|---|---|---|---|
| $703.50 | $700.00 - $707.00 | Weak | Immediate resistance at the psychological 700 level and the Upper Bollinger Band (706.85). |
Potential Chart Patterns in Formation
| Strength | Pattern | Signal | Target | Details |
|---|---|---|---|---|
| Strong | Secular Bull Trend | Bullish | N/A | A multi-decade rising channel characterized by higher highs and higher lows, supported by the 50-month and 200-month moving averages. |
| Strong | Cup and Handle Breakout (Historical) | Bullish | N/A | The price successfully consolidated during 2022 (handle/correction) after the 2021 peak and broke out aggressively in 2024, continuing the advance. |
Frequently Asked Questions about SPY
What is the current sentiment for SPY?
The short-term sentiment for SPY is currently Bullish because Price is trading near all-time highs and riding the upper Bollinger Band, indicating strong momentum. The RSI is above 70, confirming a powerful trend rather than an immediate reversal signal in this timeframe.. The long-term trend is classified as Bullish.
What are the key support levels for SPY?
StockDips.AI has identified key support levels for SPY at $605.00 and $490.00. These levels may represent potential accumulation zones where buying interest could emerge.
Is SPY in a significant dip or a Value Dip right now?
SPY has a Value Score of 34/100. It is not currently flagged as a significant dip in the Top Dips list. It is not listed as a Value Dip because the long-term sentiment or value-score threshold does not qualify.
View the full interactive analysis on StockDips.AI.