SRPT Weekly Technical Analysis
Sarepta Therapeutics, Inc
Biopharmaceutical company specializing in precision genetic medicines for rare neuromuscular diseases, particularly Duchenne muscular dystrophy (DMD)
SRPT Technical Analysis Summary
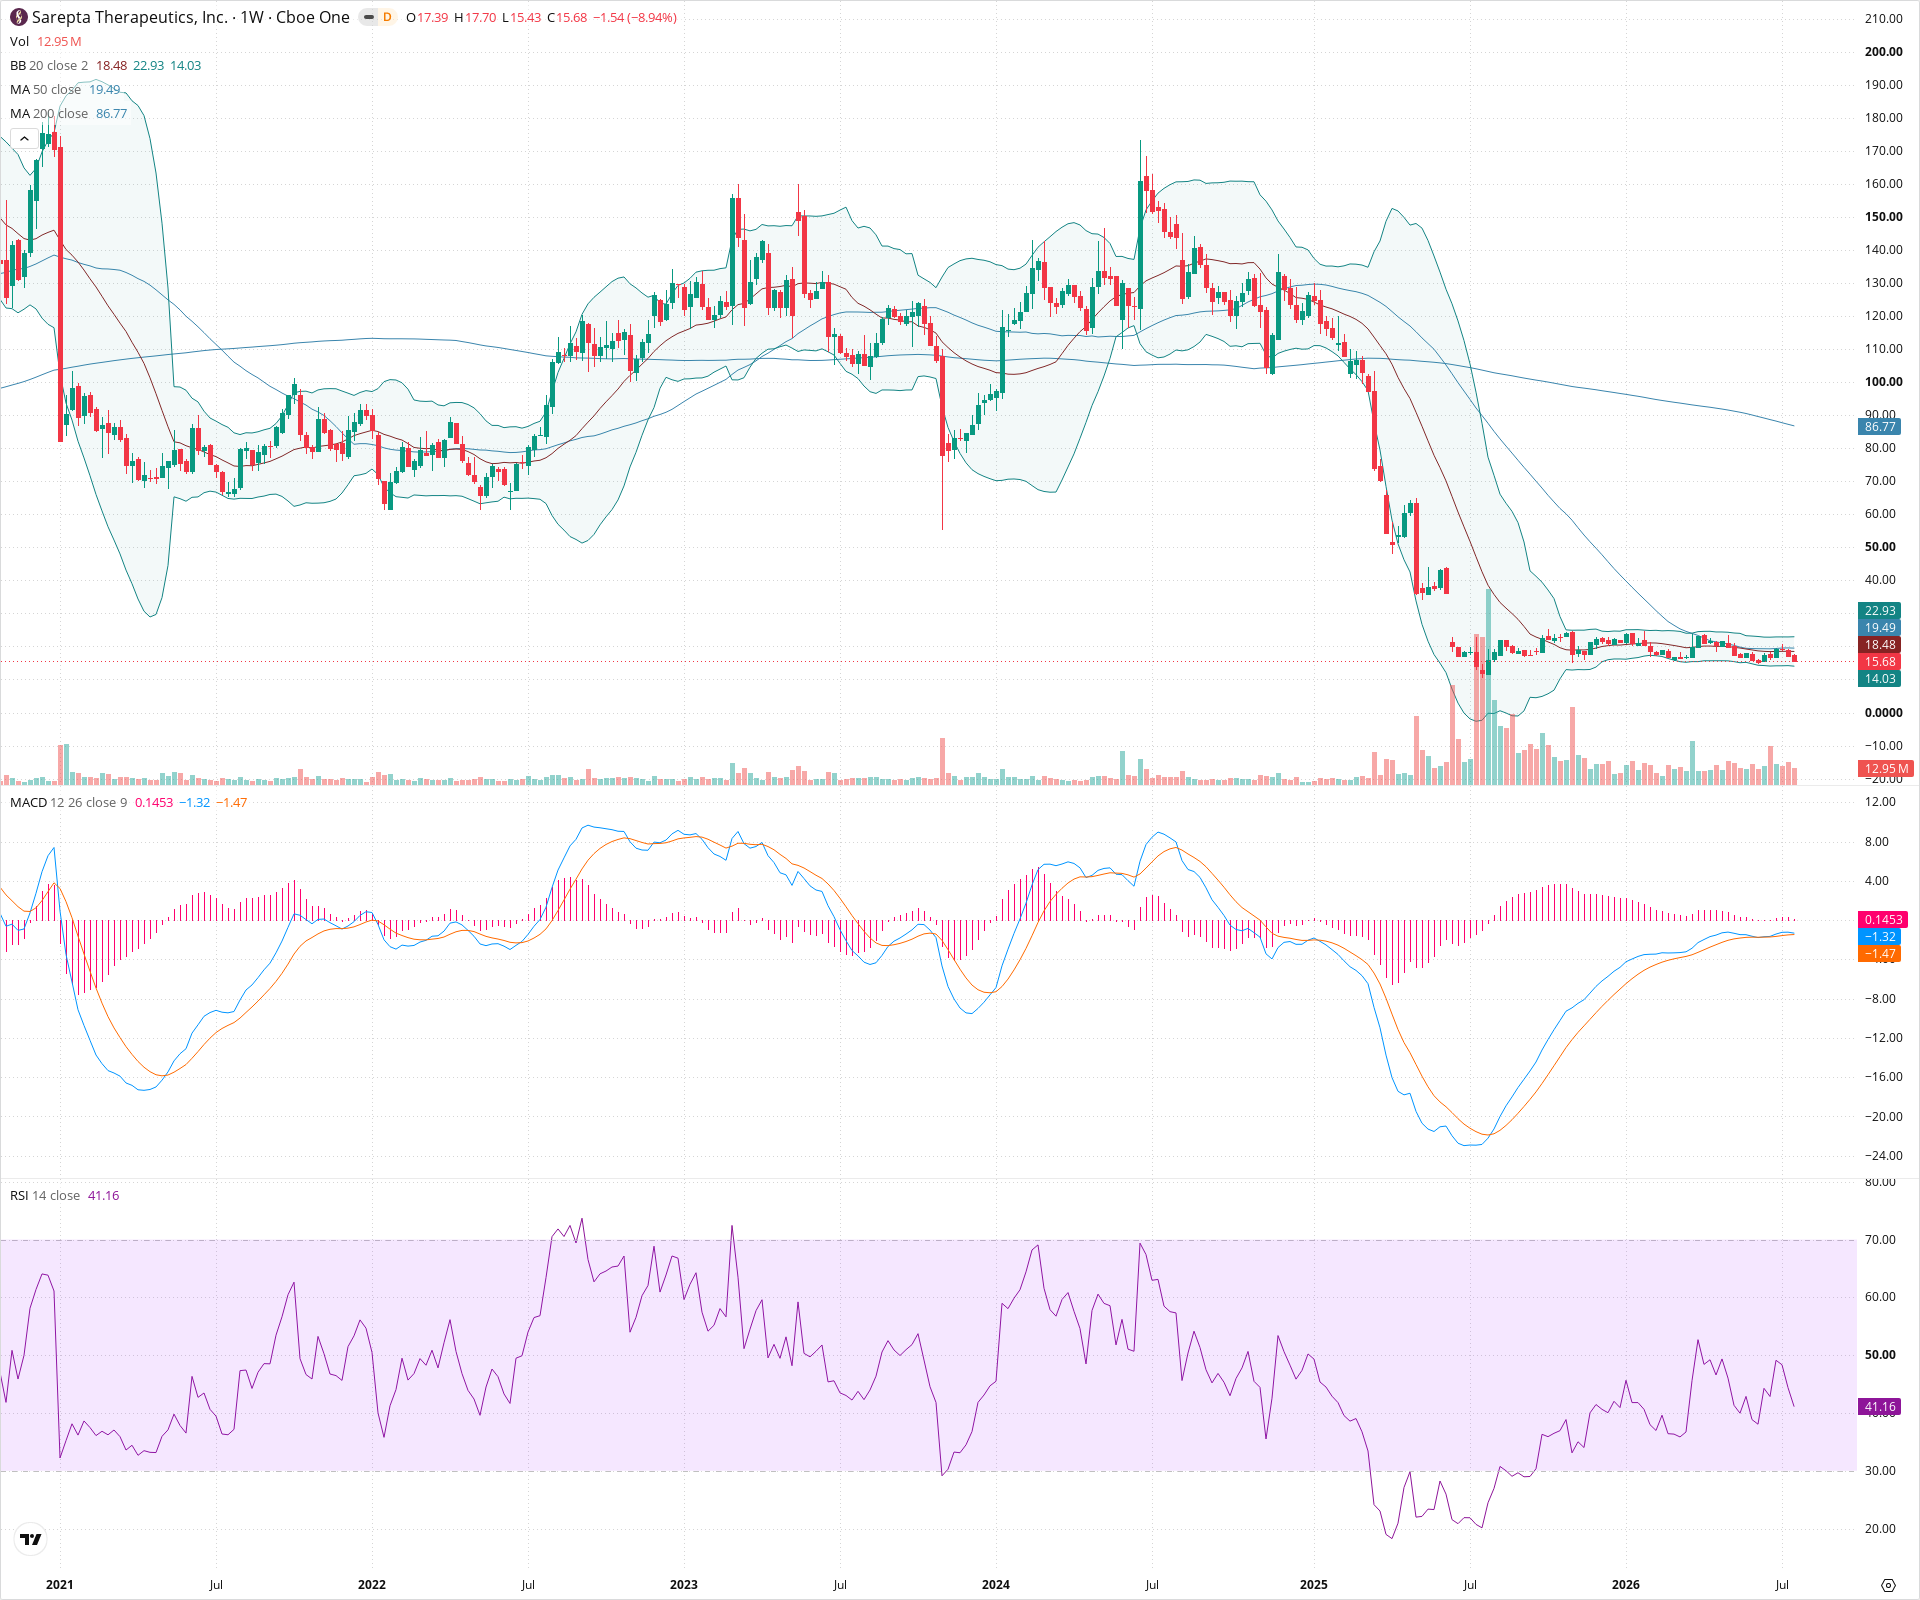
SRPT's weekly chart is dominated by the aftermath of catastrophic historical gap-downs that broke the long-term structure. The stock has since settled into a protracted consolidation phase, building a low-level base between approximately $14 and $24. While MACD and RSI show momentum resetting, the stock remains firmly capped by short-term moving averages, and the primary long-term trend remains overwhelmingly bearish until a structural breakout can be sustained.
Included In Lists
Related Tickers of Interest
SRPT Weekly Chart
Sentiment
Short-term Sentiment (days to weeks): Bearish
Price is testing the lower boundary of a prolonged consolidation range and has recently been rejected by the declining 20-week and 50-week SMAs.
Long-term Sentiment (weeks to months): Bearish
The chart displays severe technical damage from historical massive gap-downs, with price trading stranded far below a declining 200-week SMA.
Report Metadata
- Timeframe: weekly
- Generated at: 2026-07-25T09:11:18.398Z
- Model: gemini-3.1-pro-preview
Support Price Levels
| Level | Range | Strength | Notes |
|---|---|---|---|
| $14.75 | $14.00 - $15.50 | Strong | The established multi-month floor of the current sideways consolidation base. |
Resistance Price Levels
| Level | Range | Strength | Notes |
|---|---|---|---|
| $19.25 | $18.50 - $20.00 | Strong | Dynamic resistance zone created by the confluence of the flattening 20-week and 50-week SMAs. |
| $23.25 | $22.50 - $24.00 | Weak | The upper boundary of the prolonged sideways trading range. |
Potential Chart Patterns in Formation
| Strength | Pattern | Signal | Target | Details |
|---|---|---|---|---|
| Strong | Sideways Consolidation Base | Neutral | N/A | A protracted, low-volatility sideways trading range following a multi-stage price collapse, indicating long-term base building or resting before further continuation. |
Frequently Asked Questions about SRPT
What is the current sentiment for SRPT?
The short-term sentiment for SRPT is currently Bearish because Price is testing the lower boundary of a prolonged consolidation range and has recently been rejected by the declining 20-week and 50-week SMAs.. The long-term trend is classified as Bearish.
What are the key support levels for SRPT?
StockDips.AI has identified key support levels for SRPT at $14.75. These levels may represent potential accumulation zones where buying interest could emerge.
Is SRPT in a significant dip or a Value Dip right now?
SRPT has a Value Score of 70/100. It is not currently flagged as a significant dip in the Top Dips list. It is not listed as a Value Dip because the long-term sentiment or value-score threshold does not qualify.
View the full interactive analysis on StockDips.AI.