SRPT Monthly Technical Analysis
Sarepta Therapeutics, Inc
Biopharmaceutical company specializing in precision genetic medicines for rare neuromuscular diseases, particularly Duchenne muscular dystrophy (DMD)
SRPT Technical Analysis Summary
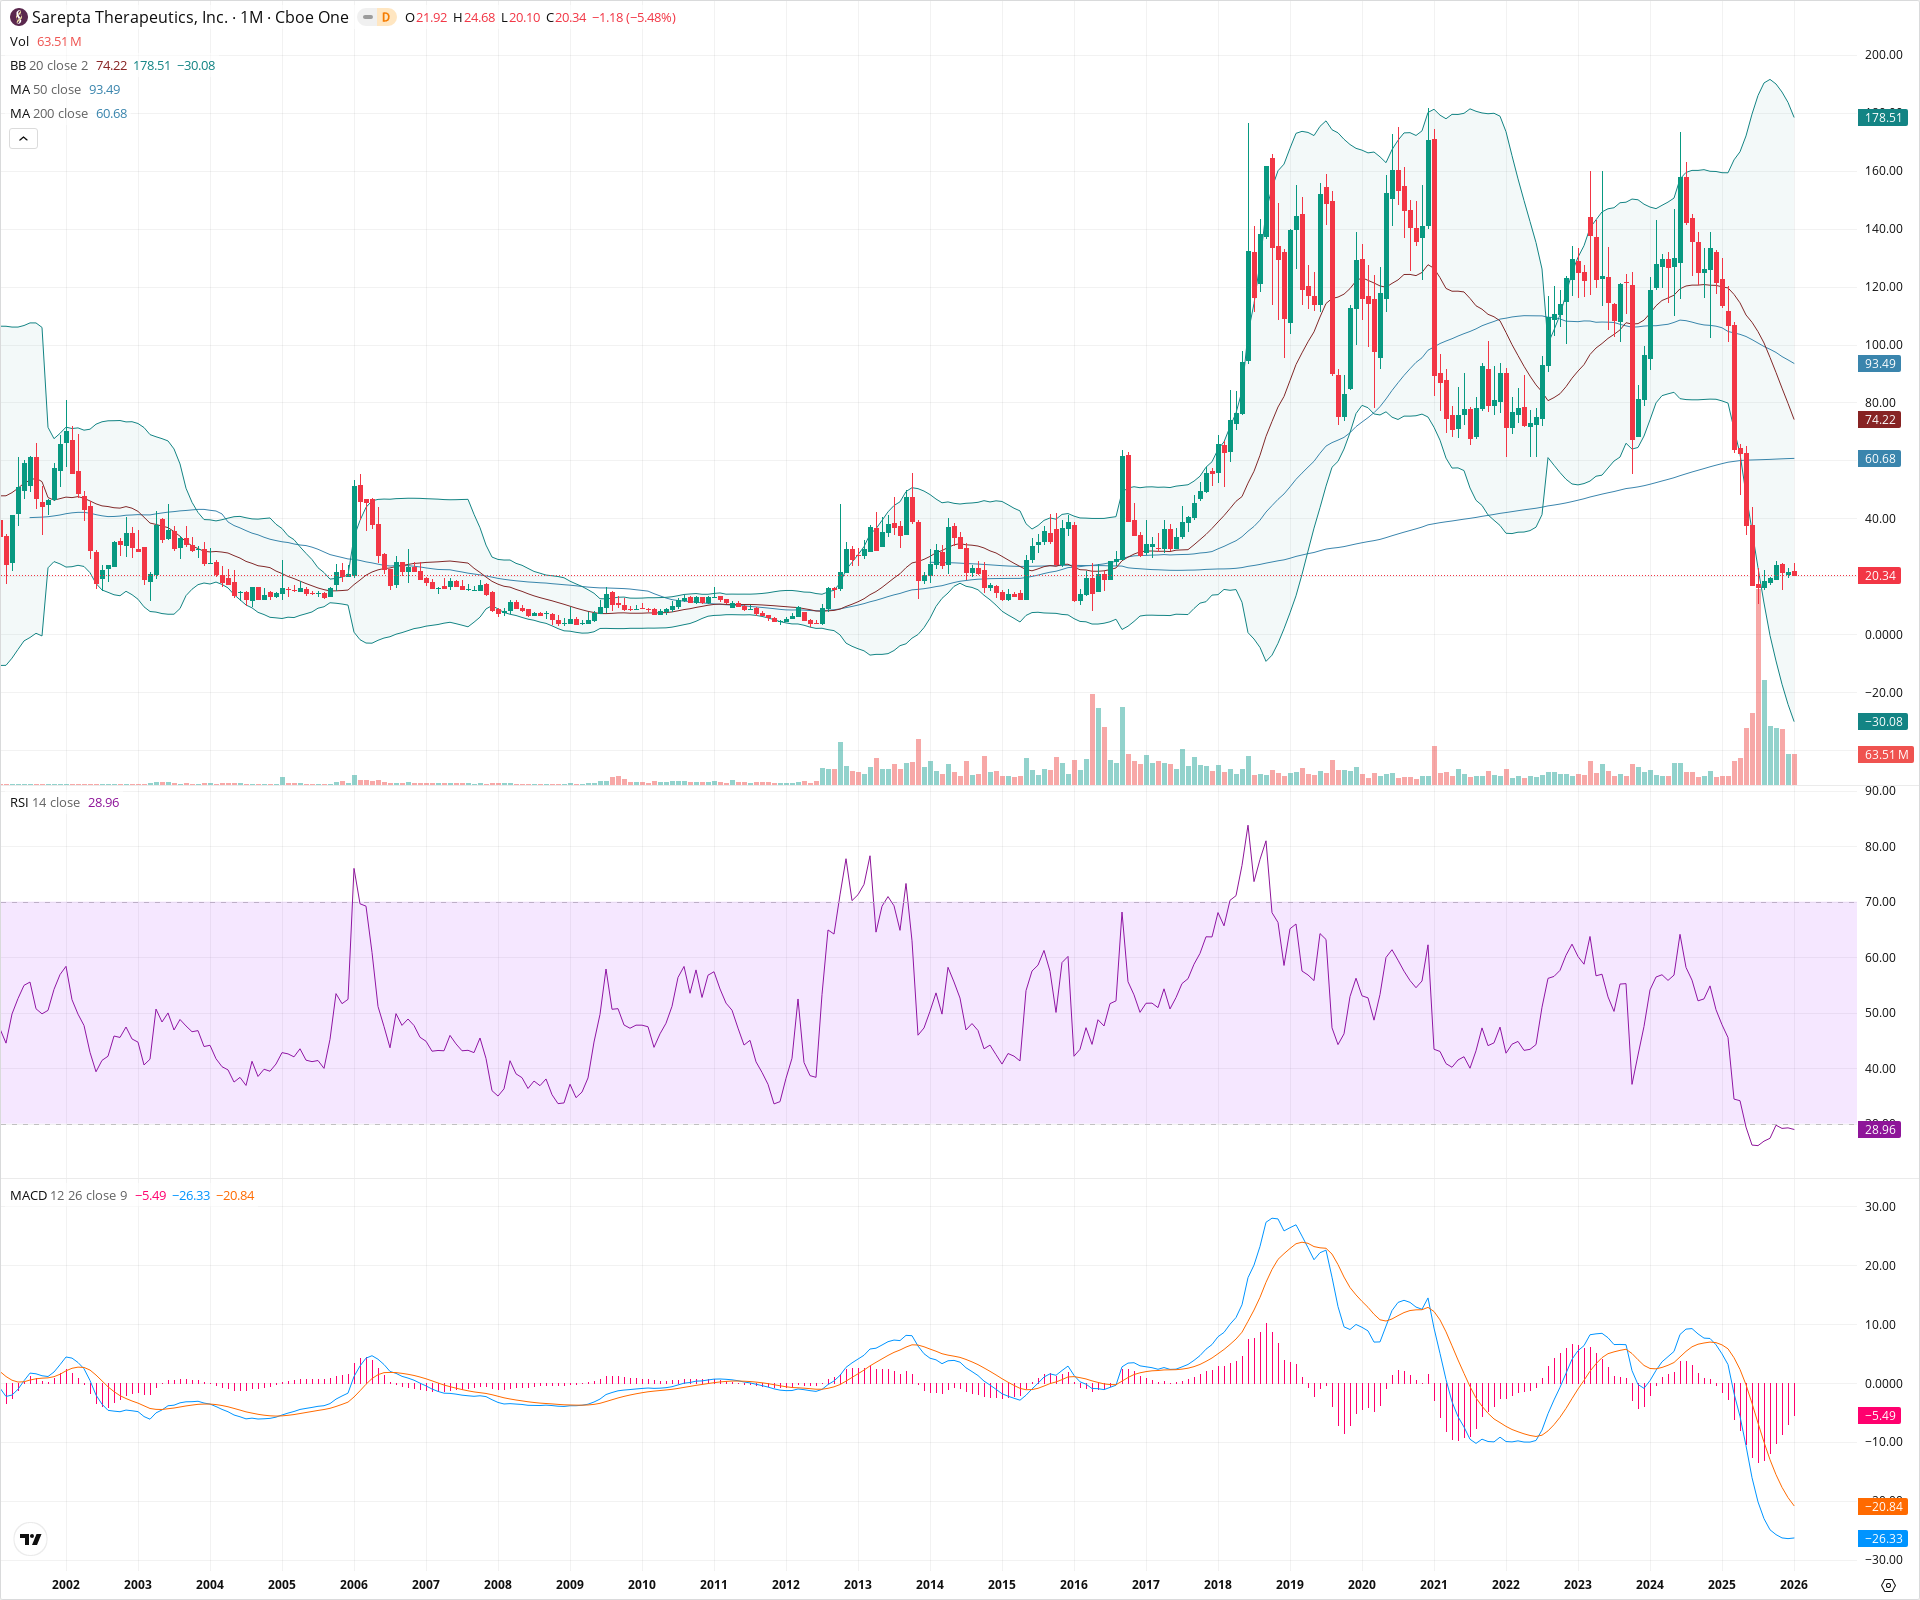
Sarepta Therapeutics is experiencing a severe secular trend reversal, having broken down from a massive multi-year topping formation. The price has collapsed significantly below its 50 and 200-month moving averages, with momentum indicators like the MACD and RSI confirming intense selling pressure and no signs of immediate stabilization. Investors should watch the $10-$15 historical base for potential long-term support, as overhead resistance is now heavy near the $60 level.
Included In Lists
Related Tickers of Interest
SRPT Monthly Chart
Sentiment
Short-term Sentiment (days to weeks): Bearish
Price is in a sharp capitulation phase, trading well below the lower Bollinger Band with expanding volume and an RSI of 28.96, indicating extreme bearish momentum.
Long-term Sentiment (weeks to months): Bearish
The stock has suffered a catastrophic structural breakdown, collapsing below the 200-month SMA and major multi-year support zones, confirmed by a deeply negative MACD regime.
Report Metadata
- Timeframe: monthly
- Generated at: 2026-02-02T06:58:28.649Z
- Model: gemini-3-pro-preview
Support Price Levels
| Level | Range | Strength | Notes |
|---|---|---|---|
| $12.50 | $10.00 - $15.00 | Strong | Historical breakout base from 2012-2013 that preceded the major secular bull run. |
| $6.00 | $4.00 - $8.00 | Weak | Long-term accumulation zone lows from the 2003-2011 period. |
Resistance Price Levels
| Level | Range | Strength | Notes |
|---|---|---|---|
| $62.50 | $60.00 - $65.00 | Strong | Major structural breakdown level coinciding with the 200-month SMA. |
| $92.50 | $90.00 - $95.00 | Strong | Confluence of the 50-month SMA and previous consolidation support turned resistance. |
Potential Chart Patterns in Formation
| Strength | Pattern | Signal | Target | Details |
|---|---|---|---|---|
| Strong | Major Distribution Top | Bearish | N/A | A massive multi-year topping pattern (resembling a complex Head and Shoulders) spanning 2018-2024, which recently resolved in a breakdown below the $60-$70 neckline area. |
Frequently Asked Questions about SRPT
What is the current sentiment for SRPT?
The short-term sentiment for SRPT is currently Bearish because Price is in a sharp capitulation phase, trading well below the lower Bollinger Band with expanding volume and an RSI of 28.96, indicating extreme bearish momentum.. The long-term trend is classified as Bearish.
What are the key support levels for SRPT?
StockDips.AI has identified key support levels for SRPT at $12.50 and $6.00. These levels may represent potential accumulation zones where buying interest could emerge.
Is SRPT in a significant dip or a Value Dip right now?
SRPT has a Value Score of 70/100. It is not currently flagged as a significant dip in the Top Dips list. It is not listed as a Value Dip because the long-term sentiment or value-score threshold does not qualify.
View the full interactive analysis on StockDips.AI.