TLT Monthly Technical Analysis
20+ Year Treasury Bond ETF
iShares 20+ Year Treasury Bond ETF - Invests in U.S. Treasury bonds with maturities of 20 years or more, often used for stability.
TLT Technical Analysis Summary
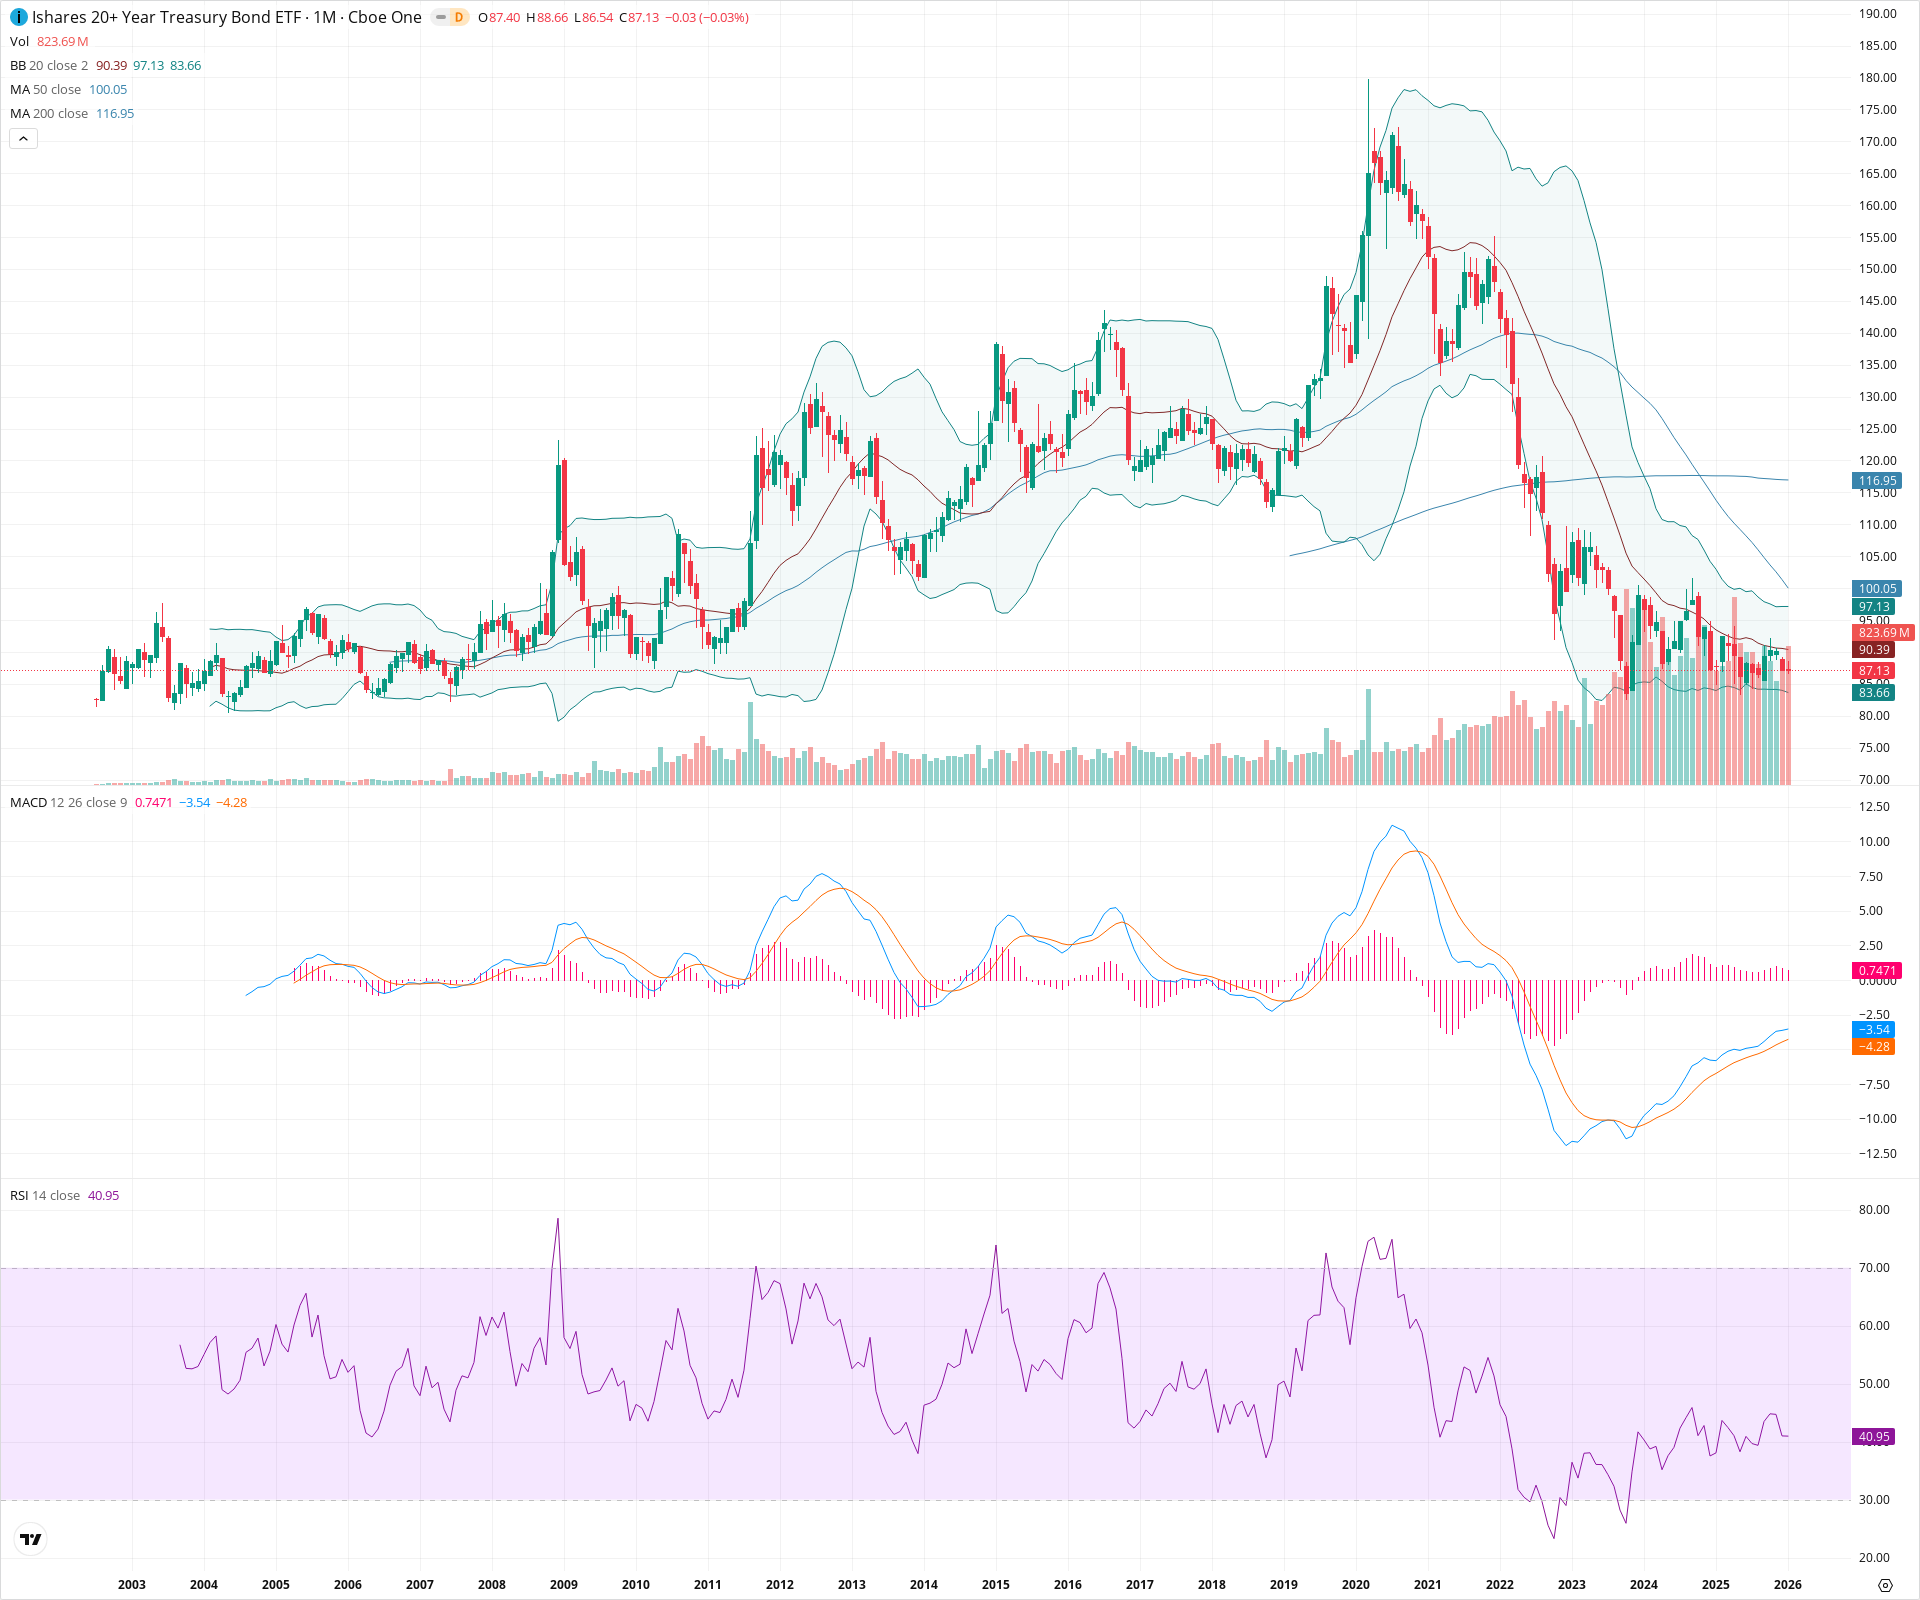
TLT remains in a long-term secular downtrend, evidenced by price trading well below the 200-month and 50-month moving averages. Currently, the asset is attempting to form a base, oscillating between major support at the recent lows near 82 and resistance around 100. While the monthly MACD has printed a bullish crossover from oversold levels suggesting decelerating downside momentum, price action has yet to reclaim key structural levels to confirm a reversal.
Included In Lists
Related Tickers of Interest
TLT Monthly Chart
Sentiment
Short-term Sentiment (days to weeks): Neutral
Price is consolidating within a defined range (approx. 82-98) following a steep decline. While the MACD histogram is positive, price remains below the 20-month SMA and is currently testing the lower end of the consolidation zone.
Long-term Sentiment (weeks to months): Bearish
The asset remains in a structural downtrend, trading significantly below the declining 50-month and 200-month SMAs. RSI is hovering near 40, indicating a lack of strong bullish momentum required to reverse the secular bear regime.
Report Metadata
- Timeframe: monthly
- Generated at: 2026-02-02T04:09:09.515Z
- Model: gemini-3-pro-preview
Support Price Levels
| Level | Range | Strength | Notes |
|---|---|---|---|
| $83.00 | $82.00 - $84.00 | Strong | Recent multi-year cycle lows formed in late 2023 and the lower Bollinger Band area. |
| $80.50 | $80.00 - $81.00 | Weak | Historical floor from the 2004-2006 period visible on the far left of the chart. |
Resistance Price Levels
| Level | Range | Strength | Notes |
|---|---|---|---|
| $91.20 | $90.39 - $92.00 | Weak | Confluence of the 20-month SMA and the midpoint of the current trading range. |
| $99.03 | $98.00 - $100.05 | Strong | Psychological round number, recent range highs, and the descending 50-month SMA. |
| $118.48 | $116.95 - $120.00 | Strong | The 200-month SMA and a major previous breakdown level. |
Potential Chart Patterns in Formation
| Strength | Pattern | Signal | Target | Details |
|---|---|---|---|---|
| Strong | Consolidation Rectangle | Neutral | N/A | After a precipitous drop from 2020 highs, price has moved sideways between roughly 82 and 98 since late 2022/early 2023. |
Frequently Asked Questions about TLT
What is the current sentiment for TLT?
The short-term sentiment for TLT is currently Neutral because Price is consolidating within a defined range (approx. 82-98) following a steep decline. While the MACD histogram is positive, price remains below the 20-month SMA and is currently testing the lower end of the consolidation zone.. The long-term trend is classified as Bearish.
What are the key support levels for TLT?
StockDips.AI has identified key support levels for TLT at $83.00 and $80.50. These levels may represent potential accumulation zones where buying interest could emerge.
Is TLT in a significant dip or a Value Dip right now?
TLT has a Value Score of 100/100. It is not currently flagged as a significant dip in the Top Dips list. It is not listed as a Value Dip because the long-term sentiment or value-score threshold does not qualify.
View the full interactive analysis on StockDips.AI.