TXRH Monthly Technical Analysis
Texas Roadhouse Inc
Chain of family steakhouses known for hand-cut steaks and casual dining.
TXRH Technical Analysis Summary
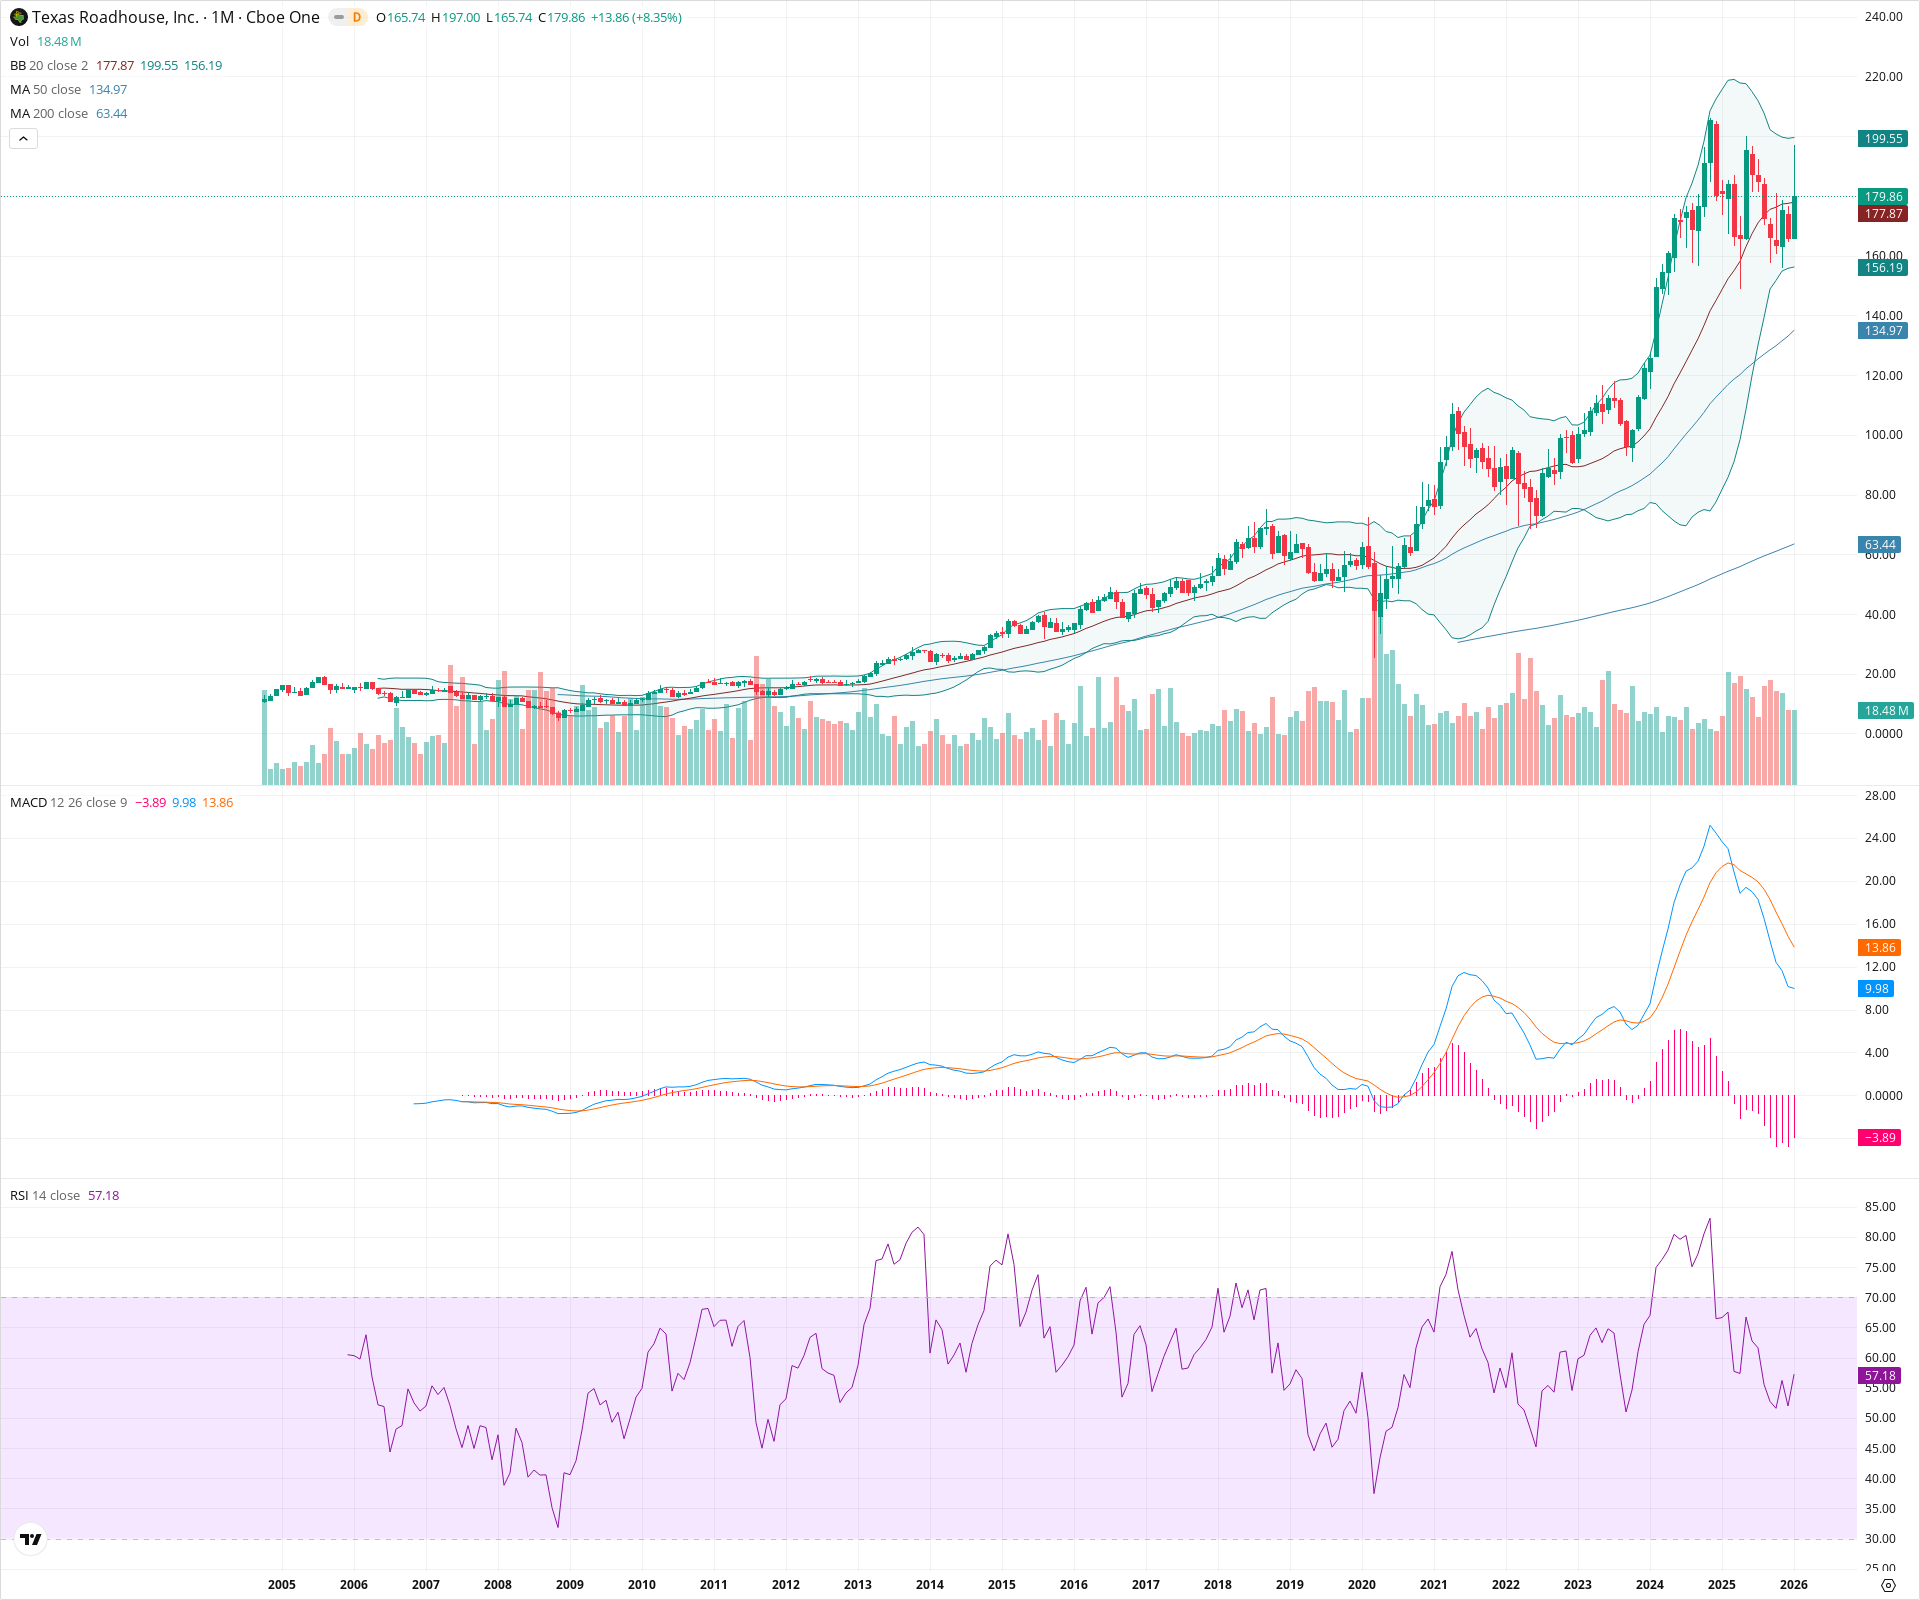
TXRH is exhibiting a powerful long-term uptrend, characterized by perfect alignment of its major moving averages (20 > 50 > 200) and sustained price action above them. Although the monthly MACD indicates a period of cooling momentum or consolidation in the near term, the structural integrity of the trend remains strong as price respects the 20-month SMA support. Investors are witnessing a potential base-building phase near all-time highs rather than a trend reversal.
Included In Lists
Related Tickers of Interest
TXRH Monthly Chart
Sentiment
Short-term Sentiment (days to weeks): Neutral
While the current month shows a price rebound, the monthly MACD has executed a bearish crossover and the histogram is negative, indicating that upward momentum has slowed and a consolidation phase is underway.
Long-term Sentiment (weeks to months): Bullish
The stock remains in a strong secular uptrend with price action well above the rising 50 and 200-period SMAs, confirming a robust long-term bullish regime.
Report Metadata
- Timeframe: monthly
- Generated at: 2026-02-02T06:59:11.012Z
- Model: gemini-3-pro-preview
Support Price Levels
| Level | Range | Strength | Notes |
|---|---|---|---|
| $153.10 | $150.00 - $156.19 | Strong | Confluence of recent consolidation lows and the rising 20-month SMA. |
| $132.50 | $130.00 - $135.00 | Strong | Major structural support aligned with the 50-month SMA. |
| $112.50 | $110.00 - $115.00 | Weak | Historical breakout zone and previous swing high area. |
Resistance Price Levels
| Level | Range | Strength | Notes |
|---|---|---|---|
| $198.28 | $197.00 - $199.55 | Strong | Recent all-time high candlestick wick and the Upper Bollinger Band. |
Potential Chart Patterns in Formation
| Strength | Pattern | Signal | Target | Details |
|---|---|---|---|---|
| Strong | Long-term Trend Channel | Bullish | N/A | A consistent multi-year rising channel defined by higher highs and higher lows since 2009. |
| Weak | Bull Flag / Consolidation | Bullish | $210.00 | Recent price action shows a pause or pullback after a steep ascent, holding above the 20 SMA. |
Frequently Asked Questions about TXRH
What is the current sentiment for TXRH?
The short-term sentiment for TXRH is currently Neutral because While the current month shows a price rebound, the monthly MACD has executed a bearish crossover and the histogram is negative, indicating that upward momentum has slowed and a consolidation phase is underway.. The long-term trend is classified as Bullish.
What are the key support levels for TXRH?
StockDips.AI has identified key support levels for TXRH at $153.10 and $132.50. These levels may represent potential accumulation zones where buying interest could emerge.
Is TXRH in a significant dip or a Value Dip right now?
TXRH has a Value Score of 30/100. It is not currently flagged as a significant dip in the Top Dips list. It is not listed as a Value Dip because the long-term sentiment or value-score threshold does not qualify.
View the full interactive analysis on StockDips.AI.