VXUS Weekly Technical Analysis
International Stock Index
Vanguard Total International Stock ETF - Covers thousands of companies across developed and emerging markets outside the U.S.
VXUS Technical Analysis Summary
VXUS remains in a robust long-term bullish uptrend, evident by upward-sloping moving averages and intact market structure. However, the asset is currently experiencing a significant short-term correction, confirmed by bearish MACD momentum. Investors should watch the crucial $77-$80 support zone (near the 50-week SMA) to see if buyers step in to resume the primary trend.
Included In Lists
Related Tickers of Interest
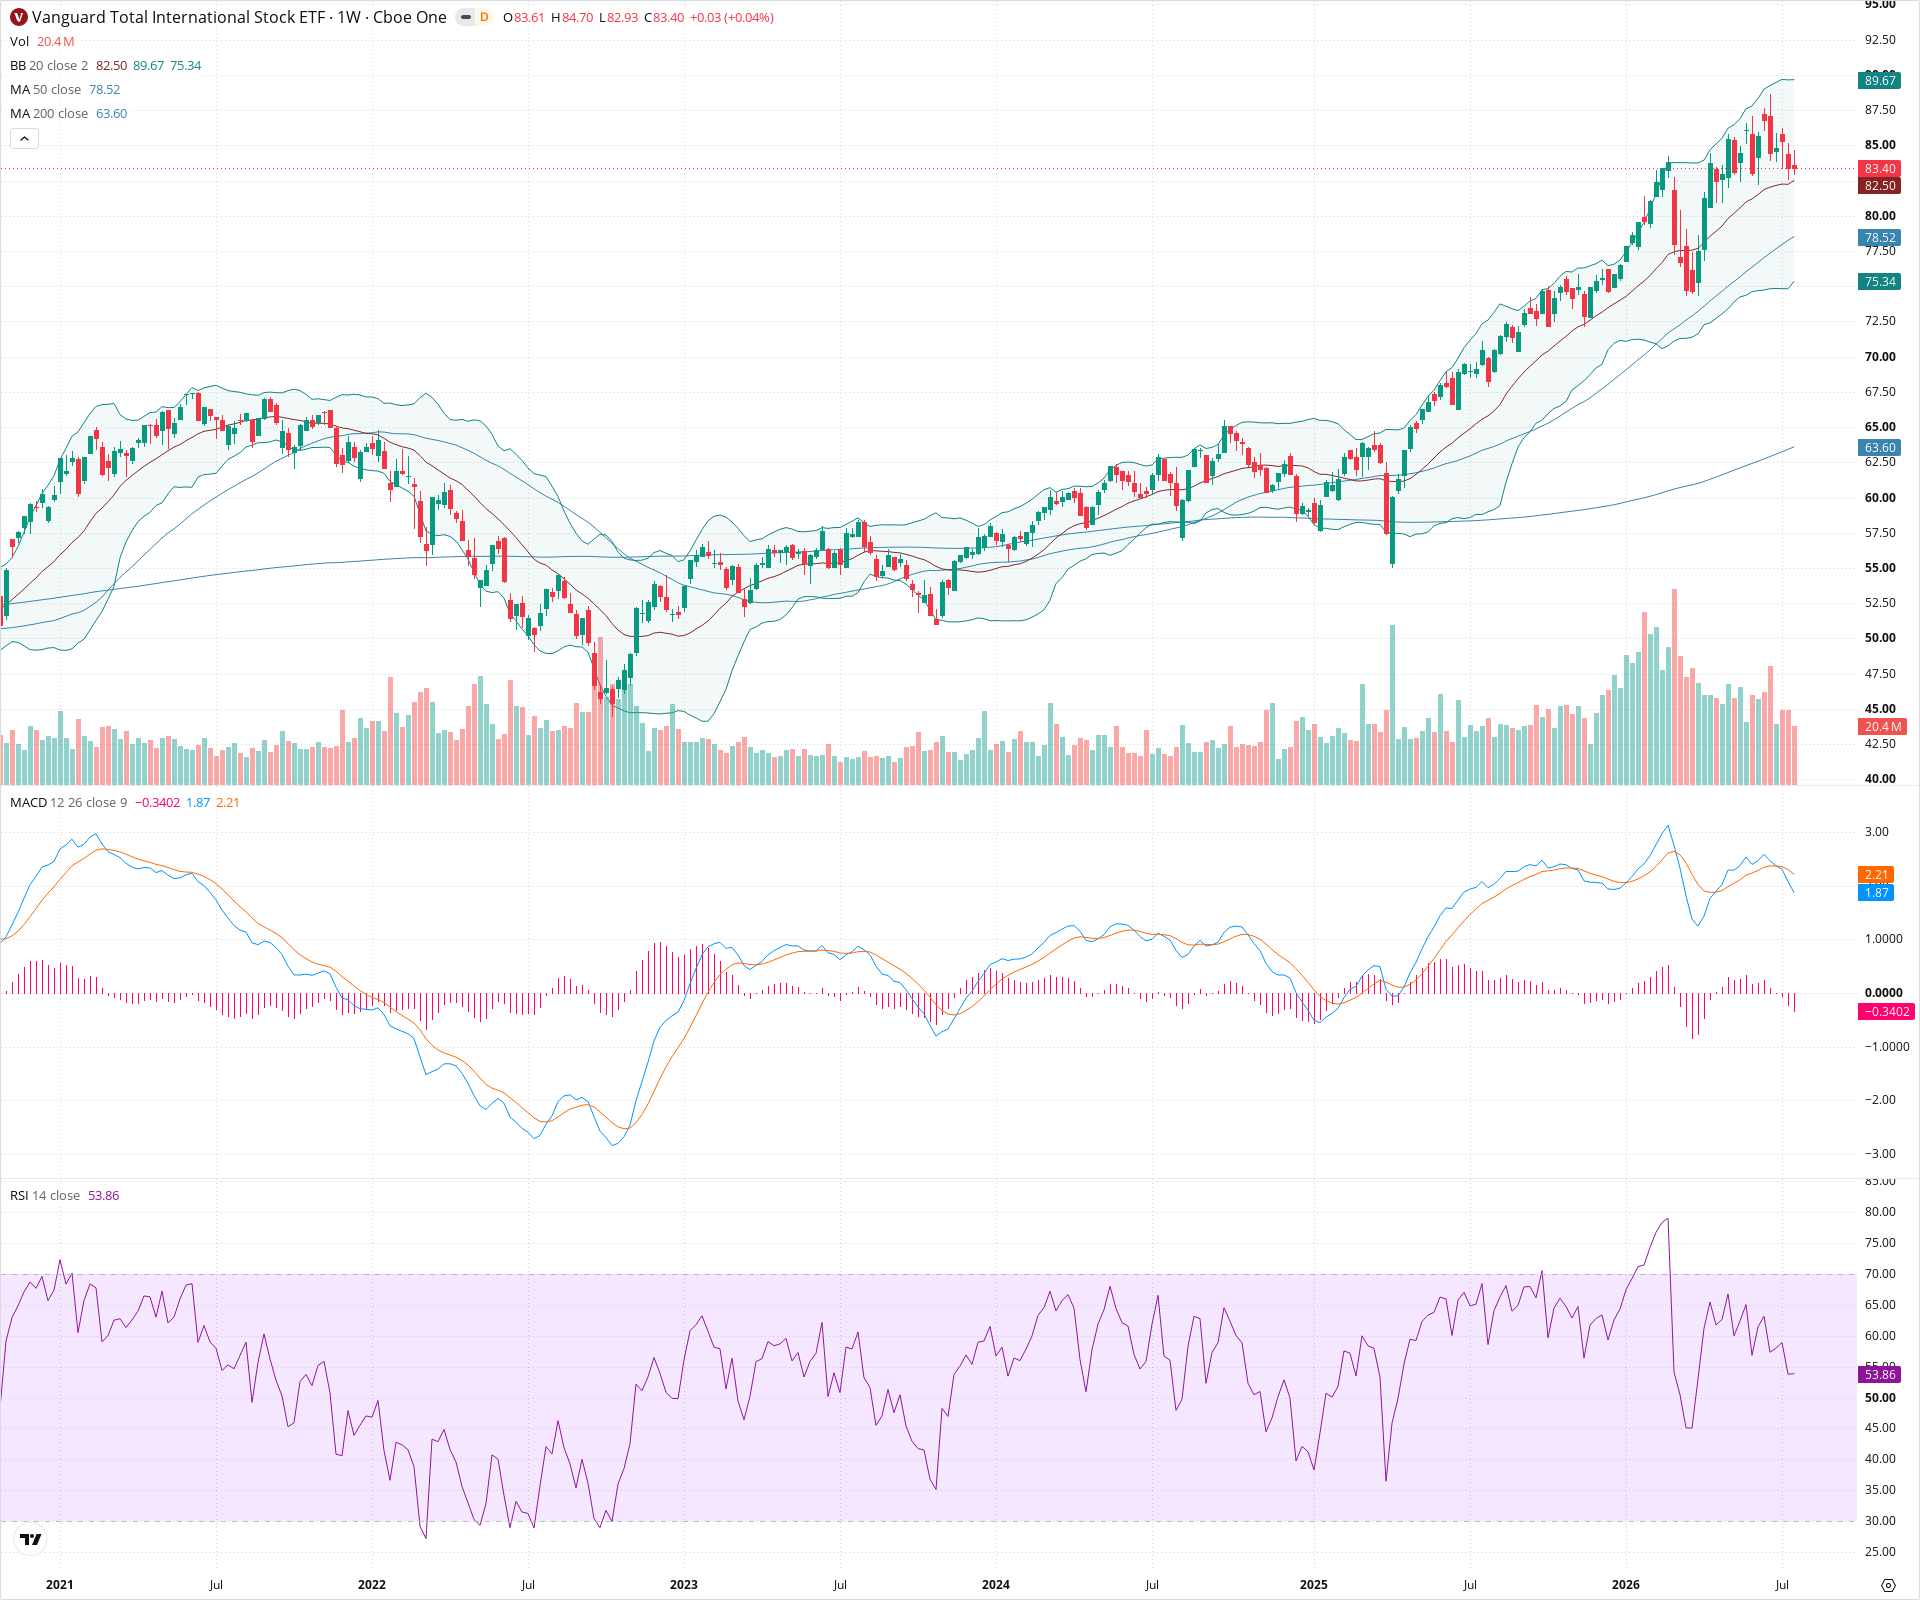
VXUS Weekly Chart
Sentiment
Short-term Sentiment (days to weeks): Bearish
Price has broken below the 20-week SMA and is actively pulling back. The weekly MACD has crossed bearishly with a negative histogram, and RSI is trending downwards, indicating a loss of short-term momentum.
Long-term Sentiment (weeks to months): Bullish
The macro trend remains strongly up, characterized by a series of higher highs and higher lows since late 2022. The 50-week SMA is rising and positioned above a rising 200-week SMA, confirming long-term trend strength.
Report Metadata
- Timeframe: weekly
- Generated at: 2026-07-25T09:01:02.398Z
- Model: gemini-3.1-pro-preview
Support Price Levels
| Level | Range | Strength | Notes |
|---|---|---|---|
| $78.50 | $77.00 - $80.00 | Strong | Confluence of previous swing highs/consolidation from mid-2023 and the currently rising 50-week SMA. |
| $66.00 | $64.00 - $68.00 | Strong | Major structural support zone from previous prolonged consolidation, closely aligning with the rising 200-week SMA. |
Resistance Price Levels
| Level | Range | Strength | Notes |
|---|---|---|---|
| $85.75 | $84.50 - $87.00 | Weak | Immediate resistance at the recently broken 20-week SMA and lower boundary of the recent top consolidation. |
| $91.50 | $90.00 - $93.00 | Strong | Recent cycle high and upper boundary of the preceding structural peak. |
Potential Chart Patterns in Formation
| Strength | Pattern | Signal | Target | Details |
|---|---|---|---|---|
| Strong | Mean Reversion Pullback | Neutral | $78.50 | After an extended run above the 20-week SMA, price is reverting towards the primary trend support (50-week SMA). |
Frequently Asked Questions about VXUS
What is the current sentiment for VXUS?
The short-term sentiment for VXUS is currently Bearish because Price has broken below the 20-week SMA and is actively pulling back. The weekly MACD has crossed bearishly with a negative histogram, and RSI is trending downwards, indicating a loss of short-term momentum.. The long-term trend is classified as Bullish.
What are the key support levels for VXUS?
StockDips.AI has identified key support levels for VXUS at $78.50 and $66.00. These levels may represent potential accumulation zones where buying interest could emerge.
Is VXUS in a significant dip or a Value Dip right now?
VXUS has a Value Score of 54/100. It is not currently flagged as a significant dip in the Top Dips list. It is not listed as a Value Dip because the long-term sentiment or value-score threshold does not qualify.
View the full interactive analysis on StockDips.AI.