VXUS Monthly Technical Analysis
International Stock Index
Vanguard Total International Stock ETF - Covers thousands of companies across developed and emerging markets outside the U.S.
VXUS Technical Analysis Summary
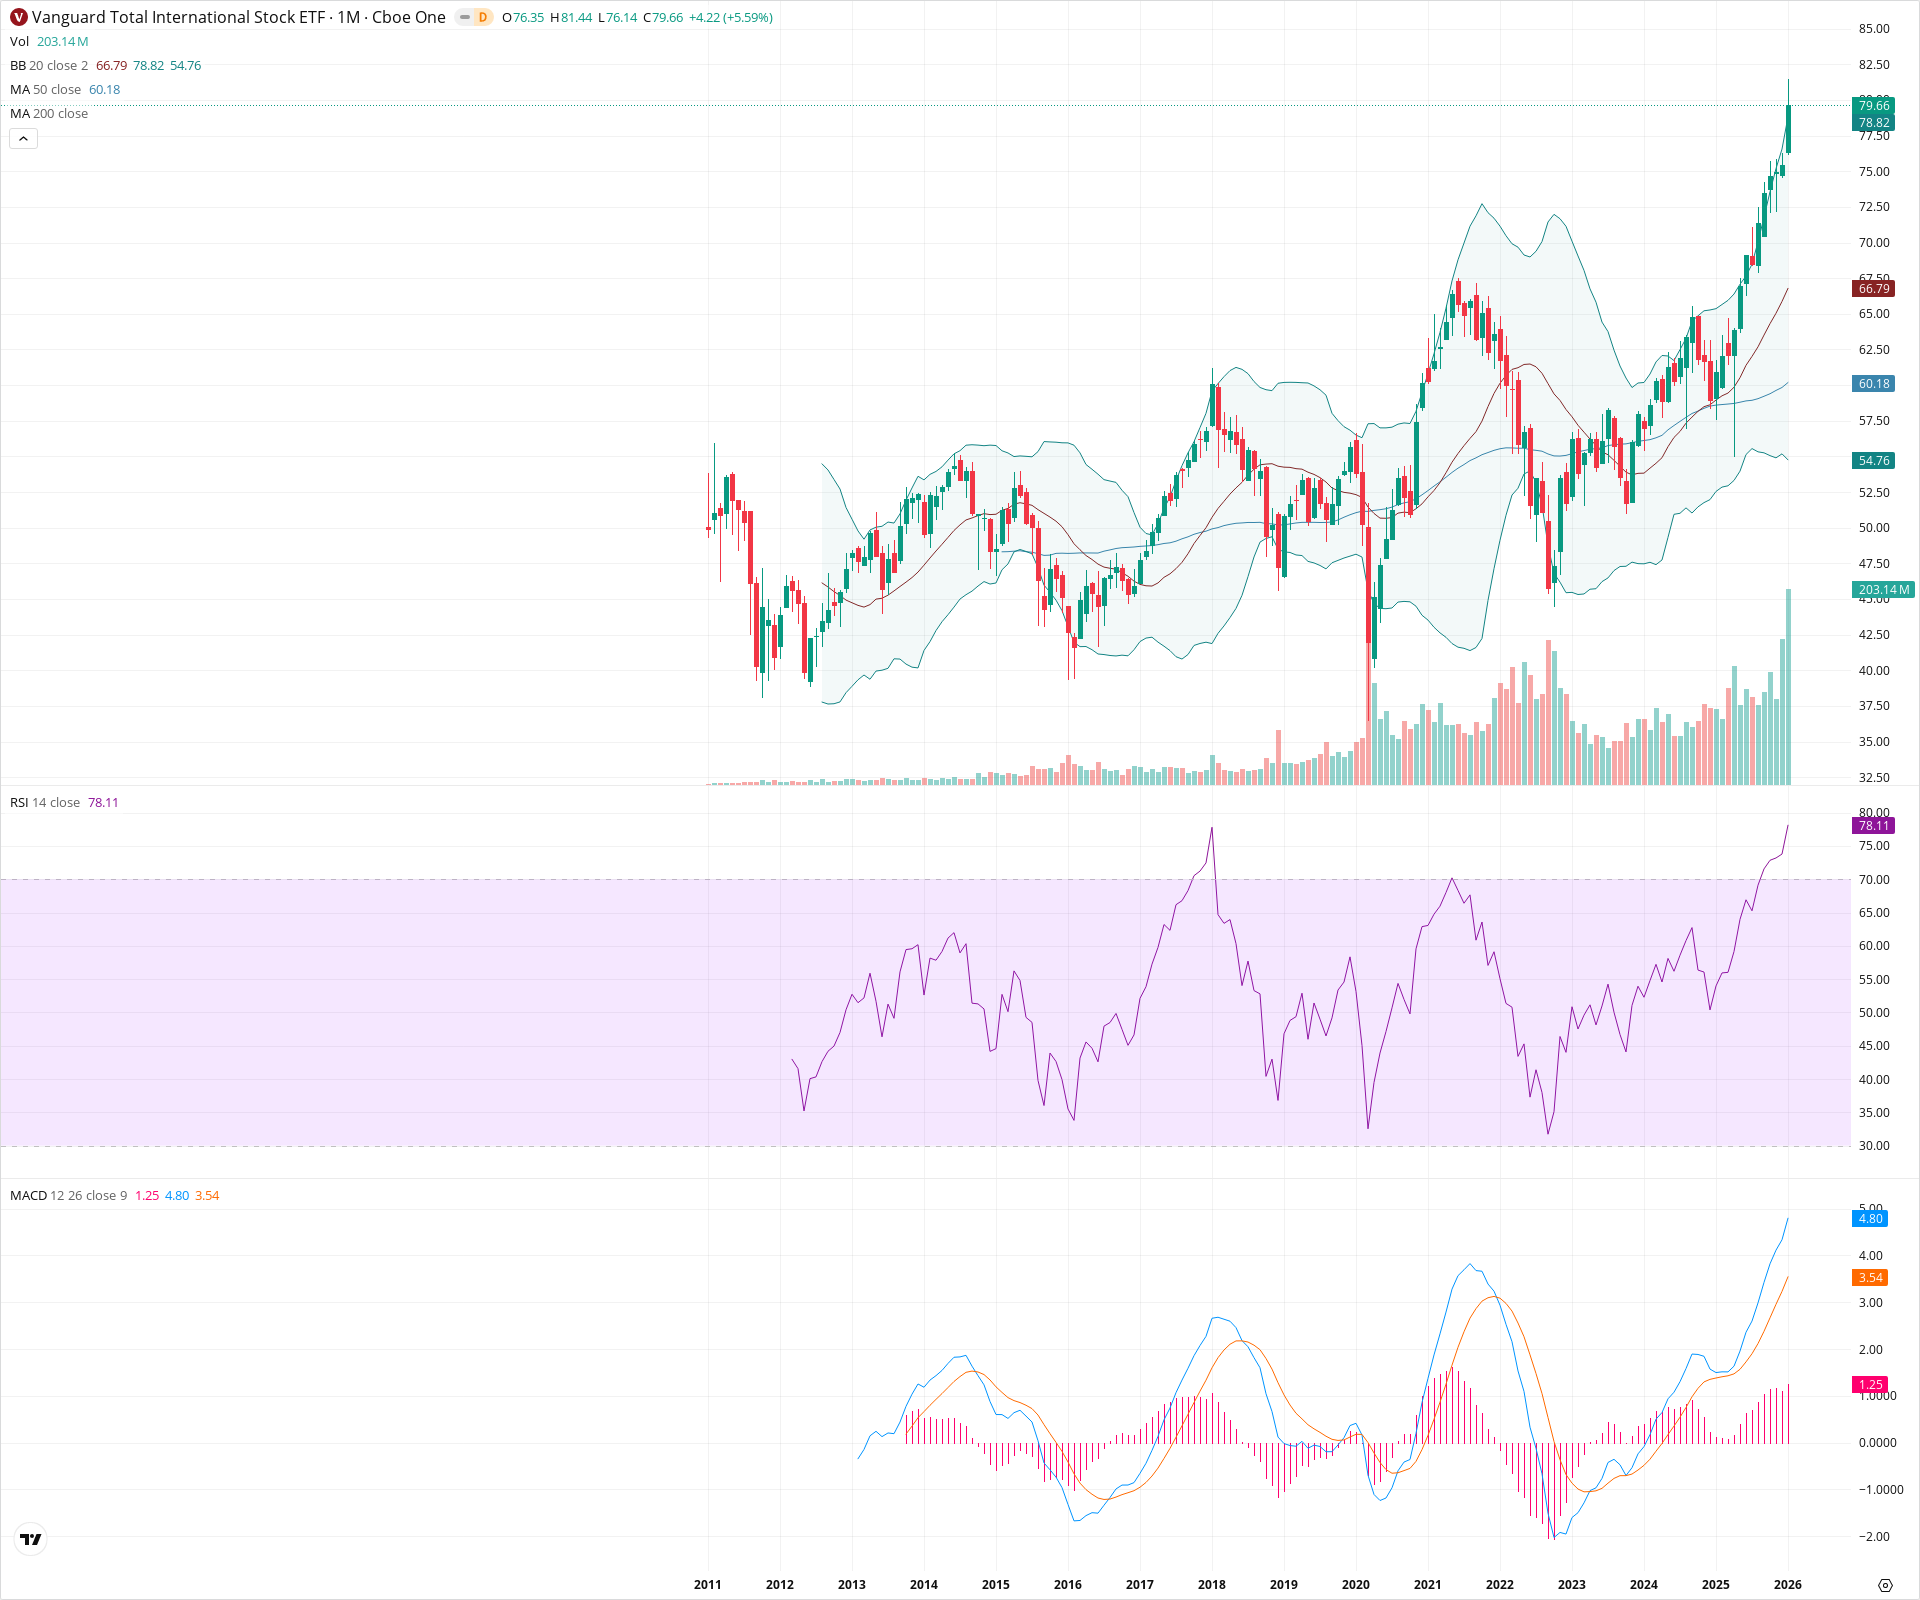
VXUS has entered a strong breakout phase, clearing previous all-time highs to trade near 80.00. Technical momentum is robust, evidenced by the MACD expanding significantly above the zero line and the RSI sustaining high levels typical of a powerful trending move. With price 'walking the bands' to the upside, the long-term outlook remains constructive, with previous resistance around 68.00 now acting as major floor support.
Included In Lists
Related Tickers of Interest
VXUS Monthly Chart
Sentiment
Short-term Sentiment (days to weeks): Bullish
Price is currently trading at all-time highs with a strong momentum candle pushing outside the upper Bollinger Band. RSI at 78.11 confirms a powerful trend regime rather than a reversal signal.
Long-term Sentiment (weeks to months): Bullish
The chart displays a confirmed breakout from a multi-year consolidation structure (2021-2024). Major moving averages (20 and 50 SMA) are sloping upwards and stacked positively, supporting a secular bull market.
Report Metadata
- Timeframe: monthly
- Generated at: 2026-02-02T04:09:22.083Z
- Model: gemini-3-pro-preview
Support Price Levels
| Level | Range | Strength | Notes |
|---|---|---|---|
| $67.65 | $66.79 - $68.50 | Strong | Confluence of the 20-month SMA (Bollinger Basis) and the former structural resistance from the 2021 highs. |
| $60.50 | $60.00 - $61.00 | Strong | Major structural support zone aligned with the 50-month SMA. |
Resistance Price Levels
| Level | Range | Strength | Notes |
|---|---|---|---|
| $82.50 | $80.00 - $85.00 | Weak | Psychological round number targets as the asset is in price discovery mode at all-time highs. |
Potential Chart Patterns in Formation
| Strength | Pattern | Signal | Target | Details |
|---|---|---|---|---|
| Strong | Multi-Year Cup and Handle Breakout | Bullish | N/A | A large rounding bottom structure formed from the 2021 highs through the 2022 lows, with a consolidation handle in late 2023. Price has now decisively broken out above the neckline. |
Frequently Asked Questions about VXUS
What is the current sentiment for VXUS?
The short-term sentiment for VXUS is currently Bullish because Price is currently trading at all-time highs with a strong momentum candle pushing outside the upper Bollinger Band. RSI at 78.11 confirms a powerful trend regime rather than a reversal signal.. The long-term trend is classified as Bullish.
What are the key support levels for VXUS?
StockDips.AI has identified key support levels for VXUS at $67.65 and $60.50. These levels may represent potential accumulation zones where buying interest could emerge.
Is VXUS in a significant dip or a Value Dip right now?
VXUS has a Value Score of 54/100. It is not currently flagged as a significant dip in the Top Dips list. It is not listed as a Value Dip because the long-term sentiment or value-score threshold does not qualify.
View the full interactive analysis on StockDips.AI.