AAPL Weekly Technical Analysis
Apple Inc
Designs consumer electronics like iPhone, iPad, and Mac, plus services such as iCloud and Apple Music.
AAPL Technical Analysis Summary
AAPL is in a commanding long-term weekly uptrend, recently breaking out to new all-time highs. Trend confirmation is strong, with price tracking the upper Bollinger Band and all major moving averages stacked bullishly. While RSI is approaching overbought levels which could invite minor consolidation, the overall technical structure remains overwhelmingly positive for long-term investors.
Included In Lists
Related Tickers of Interest
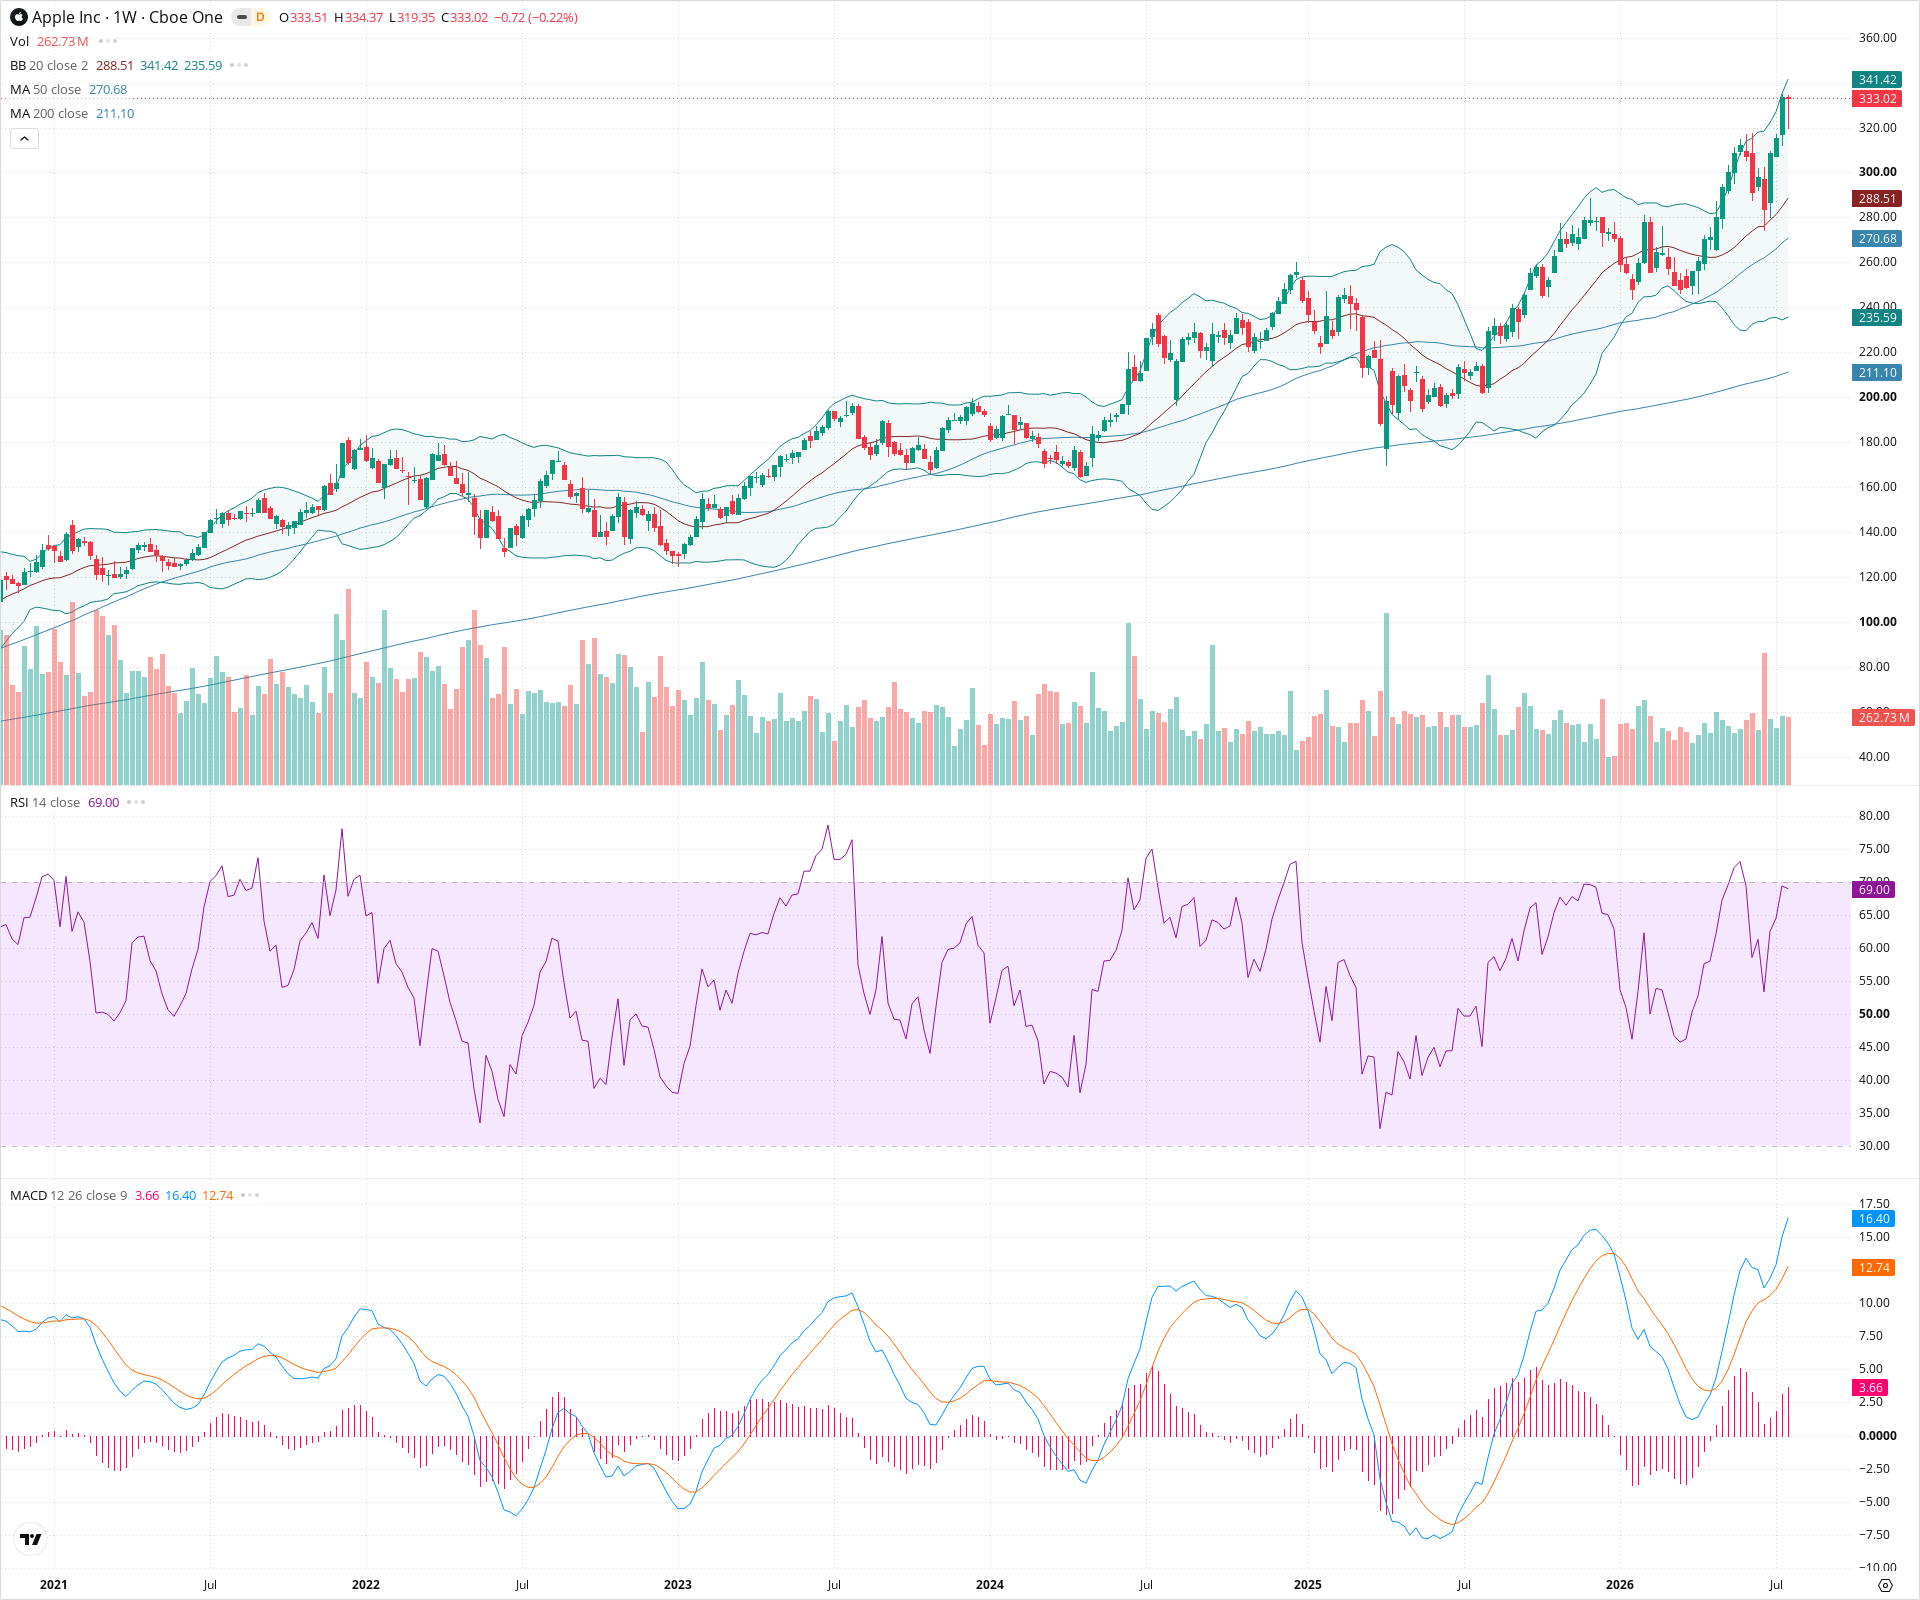
AAPL Weekly Chart
Sentiment
Short-term Sentiment (days to weeks): Bullish
Price is aggressively pushing the upper Bollinger Band with strong green weekly candles. MACD lines are expanding upwards and RSI is elevated near 69, indicating powerful short-term momentum.
Long-term Sentiment (weeks to months): Bullish
The chart exhibits a textbook long-term uptrend characterized by consistent higher highs and higher lows. Price is well above all major weekly moving averages (20, 50, 200), which are all trending upwards in a bullish alignment.
Report Metadata
- Timeframe: weekly
- Generated at: 2026-07-25T09:12:43.998Z
- Model: gemini-3.1-pro-preview
Support Price Levels
| Level | Range | Strength | Notes |
|---|---|---|---|
| $290.00 | $285.00 - $295.00 | Strong | Recent major breakout zone and prior resistance, now acting as support. Confluent with the rising 20-week SMA. |
| $267.50 | $260.00 - $275.00 | Strong | Significant previous swing low consolidation area and confluence with the rising 50-week SMA. |
| $207.50 | $200.00 - $215.00 | Strong | Deep structural support zone aligned with the 200-week SMA, representing the base of the longer-term uptrend. |
Resistance Price Levels
| Level | Range | Strength | Notes |
|---|---|---|---|
| $345.00 | $340.00 - $350.00 | Weak | As the stock is in price discovery at all-time highs, resistance is primarily psychological and based on the upper Bollinger Band trajectory. |
Potential Chart Patterns in Formation
| Strength | Pattern | Signal | Target | Details |
|---|---|---|---|---|
| Strong | Multi-month Breakout | Bullish | N/A | Price recently decisively broke above a multi-month consolidation level near 290, igniting the current steep upward advance. |
| Strong | Sustained Uptrend | Bullish | N/A | A clear, accelerating sequence of higher highs and higher lows stretching back years, supported by rising moving averages and positive MACD. |
Frequently Asked Questions about AAPL
What is the current sentiment for AAPL?
The short-term sentiment for AAPL is currently Bullish because Price is aggressively pushing the upper Bollinger Band with strong green weekly candles. MACD lines are expanding upwards and RSI is elevated near 69, indicating powerful short-term momentum.. The long-term trend is classified as Bullish.
What are the key support levels for AAPL?
StockDips.AI has identified key support levels for AAPL at $290.00 and $267.50. These levels may represent potential accumulation zones where buying interest could emerge.
Is AAPL in a significant dip or a Value Dip right now?
AAPL has a Value Score of 20/100. It is not currently flagged as a significant dip in the Top Dips list. It is not listed as a Value Dip because the long-term sentiment or value-score threshold does not qualify.
View the full interactive analysis on StockDips.AI.