NFLX Daily Technical Analysis
Netflix Inc
Leading video streaming service producing and distributing original and licensed content.
NFLX Technical Analysis Summary
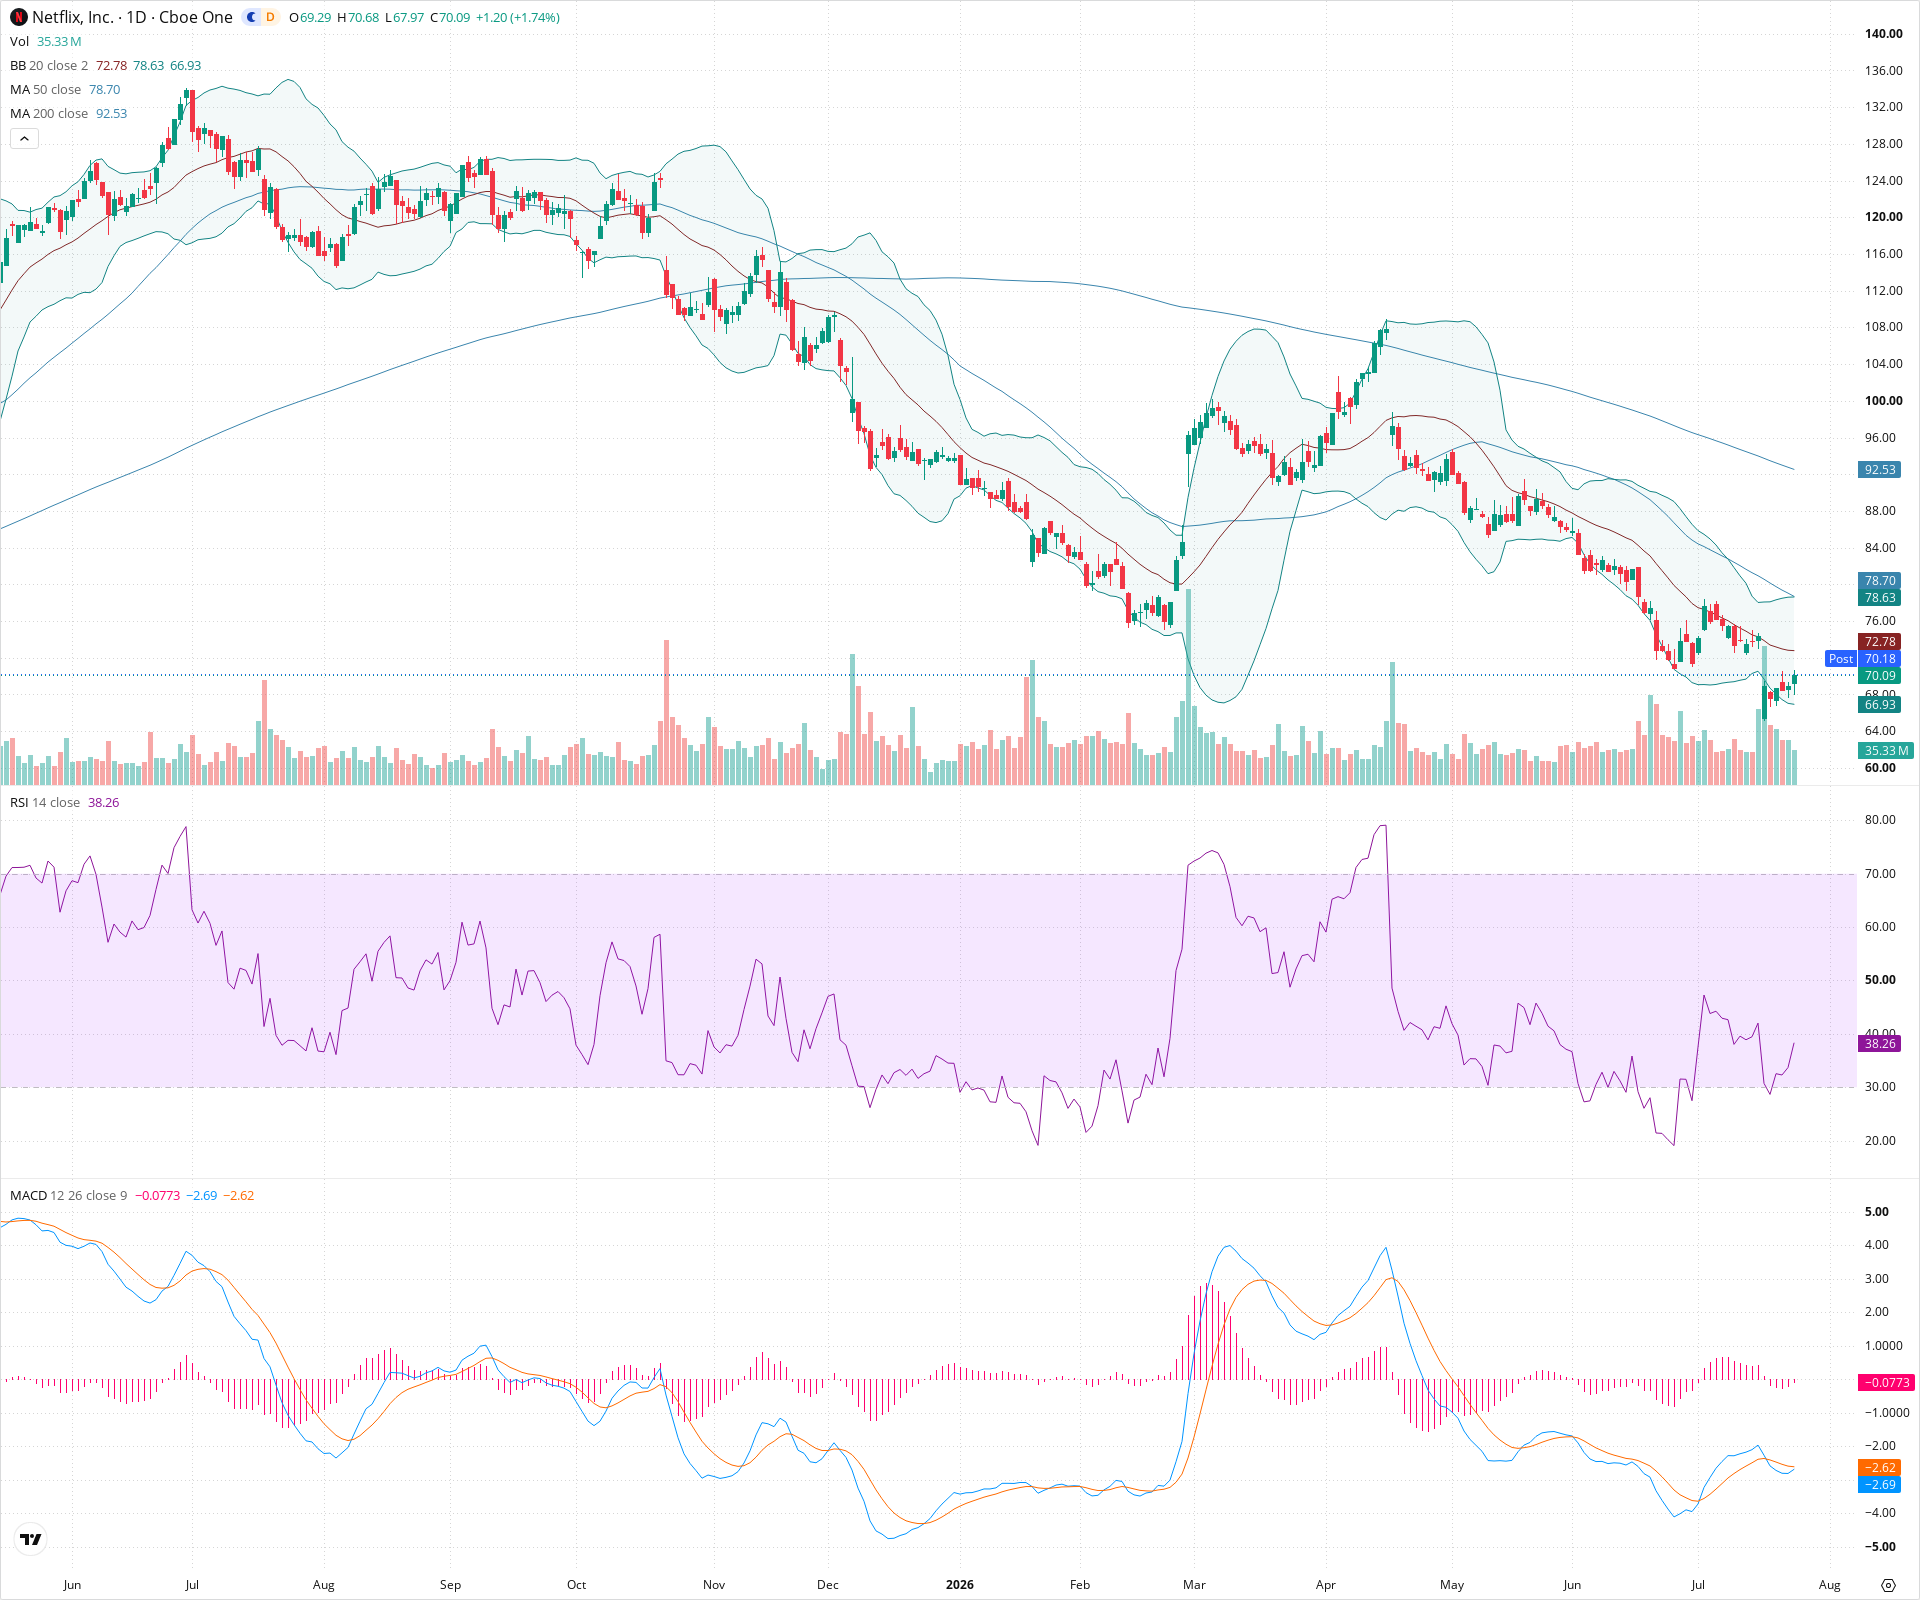
NFLX remains in a dominant long-term downtrend, confirmed by price action staying well below declining major moving averages (50 and 200 SMAs). However, in the short term, the stock has become heavily oversold, triggering a counter-trend bounce supported by bullish momentum shifts in the RSI and MACD. Long-term investors should view this as a potential relief rally within a bear market until major overhead resistance is broken and a new base forms.
Included In Lists
Related Tickers of Interest
NFLX Daily Chart
Sentiment
Short-term Sentiment (days to weeks): Bullish
Price is experiencing a counter-trend bounce off the lower Bollinger Band after reaching deeply oversold territory. This is supported by rising RSI from below 30 and a recent bullish crossover on the MACD.
Long-term Sentiment (weeks to months): Bearish
The chart displays a pronounced, sustained downtrend. Price is well below downward-sloping 50-day and 200-day SMAs, indicating significant long-term bearish momentum and overhead supply.
Report Metadata
- Timeframe: daily
- Generated at: 2026-07-24T21:14:12.800Z
- Model: gemini-3.1-pro-preview
Support Price Levels
| Level | Range | Strength | Notes |
|---|---|---|---|
| $67.00 | $66.00 - $68.00 | Strong | Recent swing low and confluence with the lower Bollinger Band; key level to hold to prevent further downside acceleration. |
Resistance Price Levels
| Level | Range | Strength | Notes |
|---|---|---|---|
| $72.75 | $72.50 - $73.00 | Weak | Immediate resistance at the 20-period SMA (middle Bollinger Band). |
| $79.00 | $78.00 - $80.00 | Strong | Confluence of the 50-day SMA, upper Bollinger Band, and a previous consolidation zone. |
| $91.50 | $90.00 - $93.00 | Strong | Major overhead resistance zone aligned with the 200-day SMA and historical structural breakdown levels. |
Potential Chart Patterns in Formation
| Strength | Pattern | Signal | Target | Details |
|---|---|---|---|---|
| Weak | Oversold Mean Reversion | Bullish | $78.50 | Price extended far below the moving averages and lower Bollinger Band, driving RSI below 30. The current price action is a reversion bounce toward the mean (20-day or 50-day SMA). |
Frequently Asked Questions about NFLX
What is the current sentiment for NFLX?
The short-term sentiment for NFLX is currently Bullish because Price is experiencing a counter-trend bounce off the lower Bollinger Band after reaching deeply oversold territory. This is supported by rising RSI from below 30 and a recent bullish crossover on the MACD.. The long-term trend is classified as Bearish.
What are the key support levels for NFLX?
StockDips.AI has identified key support levels for NFLX at $67.00. These levels may represent potential accumulation zones where buying interest could emerge.
Is NFLX in a significant dip or a Value Dip right now?
NFLX has a Value Score of 46/100. It is not currently flagged as a significant dip in the Top Dips list. It is not listed as a Value Dip because the long-term sentiment or value-score threshold does not qualify.
View the full interactive analysis on StockDips.AI.