AAPL Monthly Technical Analysis
Apple Inc
Designs consumer electronics like iPhone, iPad, and Mac, plus services such as iCloud and Apple Music.
AAPL Technical Analysis Summary
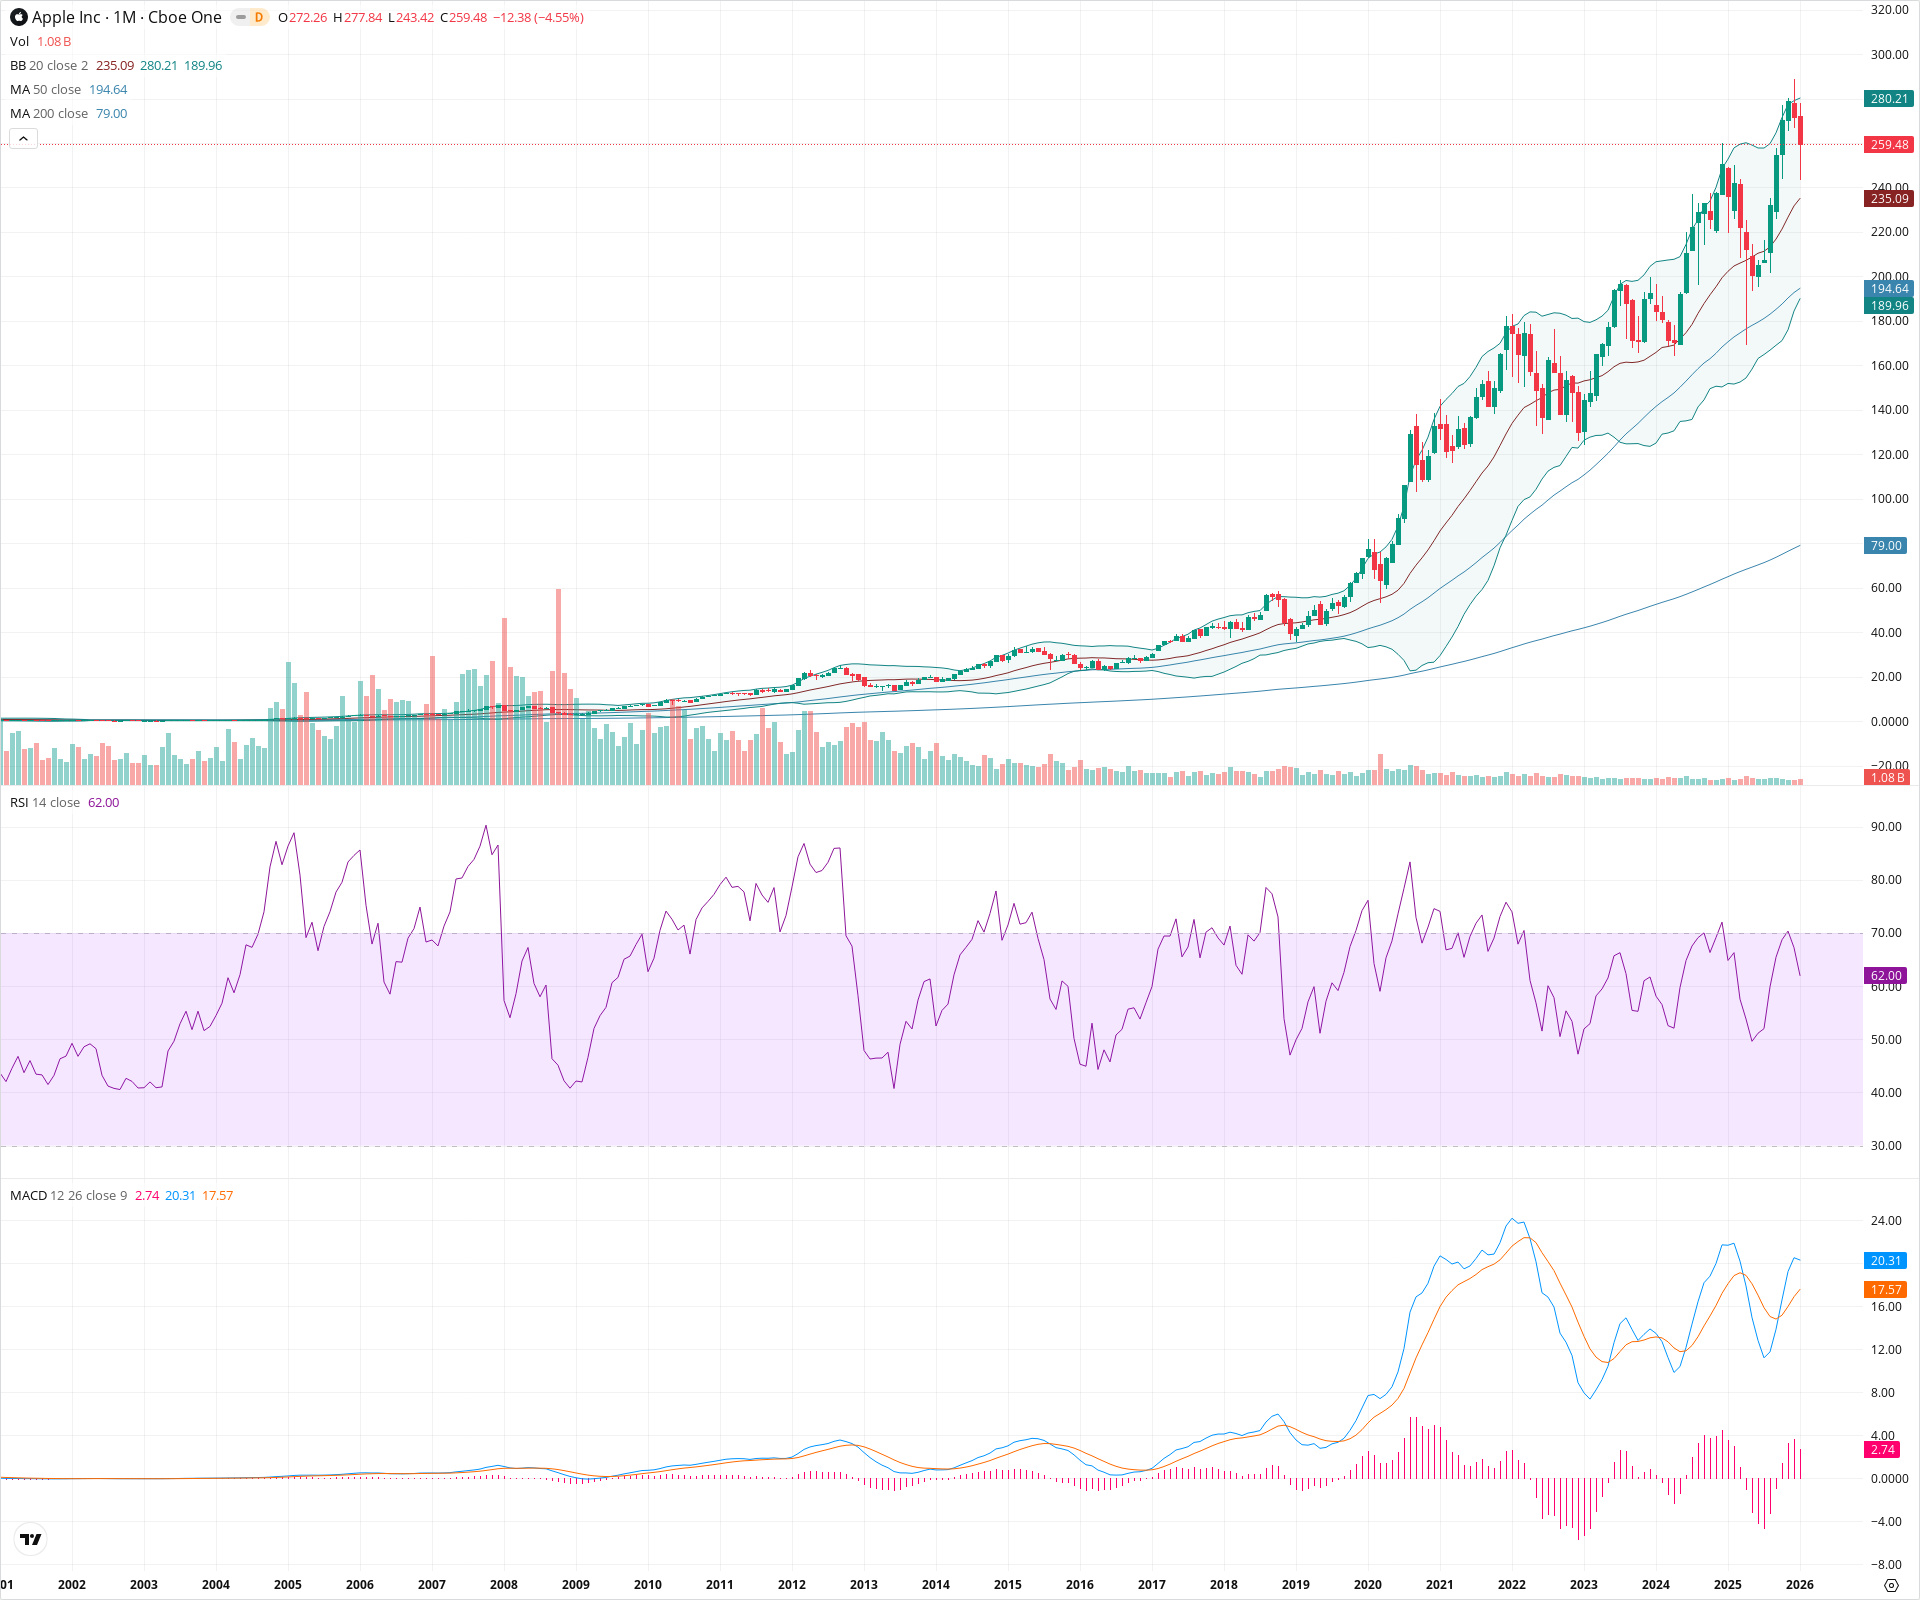
Apple Inc. maintains a robust long-term bullish structure, trading significantly above its rising 50-month and 200-month moving averages. While the current month shows a retracement from new all-time highs near 278, the momentum remains positive with the MACD well above the zero line and RSI in bullish territory. The primary trend suggests pullbacks are likely to find support at the rising 20-month SMA or previous breakout zones.
Included In Lists
Related Tickers of Interest
AAPL Monthly Chart
Sentiment
Short-term Sentiment (days to weeks): Bullish
Despite a current monthly pullback of ~4.5%, the price remains in a steep uptrend well above the 20-month SMA support, with RSI holding above 60.
Long-term Sentiment (weeks to months): Bullish
Strong secular trend characterized by consistent higher highs, price far above rising 50 and 200-month SMAs, and a positive monthly MACD configuration.
Report Metadata
- Timeframe: monthly
- Generated at: 2026-02-02T05:10:37.010Z
- Model: gemini-3-pro-preview
Support Price Levels
| Level | Range | Strength | Notes |
|---|---|---|---|
| $232.50 | $230.00 - $235.00 | Strong | Aligns with the 20-month SMA (Bollinger Band basis) which acts as dynamic trend support. |
| $195.00 | $190.00 - $200.00 | Strong | Former major resistance zone turned support, coinciding with the 50-month SMA. |
| $165.00 | $160.00 - $170.00 | Weak | Previous swing low consolidation base. |
Resistance Price Levels
| Level | Range | Strength | Notes |
|---|---|---|---|
| $278.50 | $277.00 - $280.00 | Strong | Recent all-time high and current cycle peak. |
Potential Chart Patterns in Formation
| Strength | Pattern | Signal | Target | Details |
|---|---|---|---|---|
| Strong | Secular Bull Channel | Bullish | N/A | A multi-year ascending structure defined by rising moving averages and successive breakout rallies. |
Frequently Asked Questions about AAPL
What is the current sentiment for AAPL?
The short-term sentiment for AAPL is currently Bullish because Despite a current monthly pullback of ~4.5%, the price remains in a steep uptrend well above the 20-month SMA support, with RSI holding above 60.. The long-term trend is classified as Bullish.
What are the key support levels for AAPL?
StockDips.AI has identified key support levels for AAPL at $232.50 and $195.00. These levels may represent potential accumulation zones where buying interest could emerge.
Is AAPL in a significant dip or a Value Dip right now?
AAPL has a Value Score of 20/100. It is not currently flagged as a significant dip in the Top Dips list. It is not listed as a Value Dip because the long-term sentiment or value-score threshold does not qualify.
View the full interactive analysis on StockDips.AI.