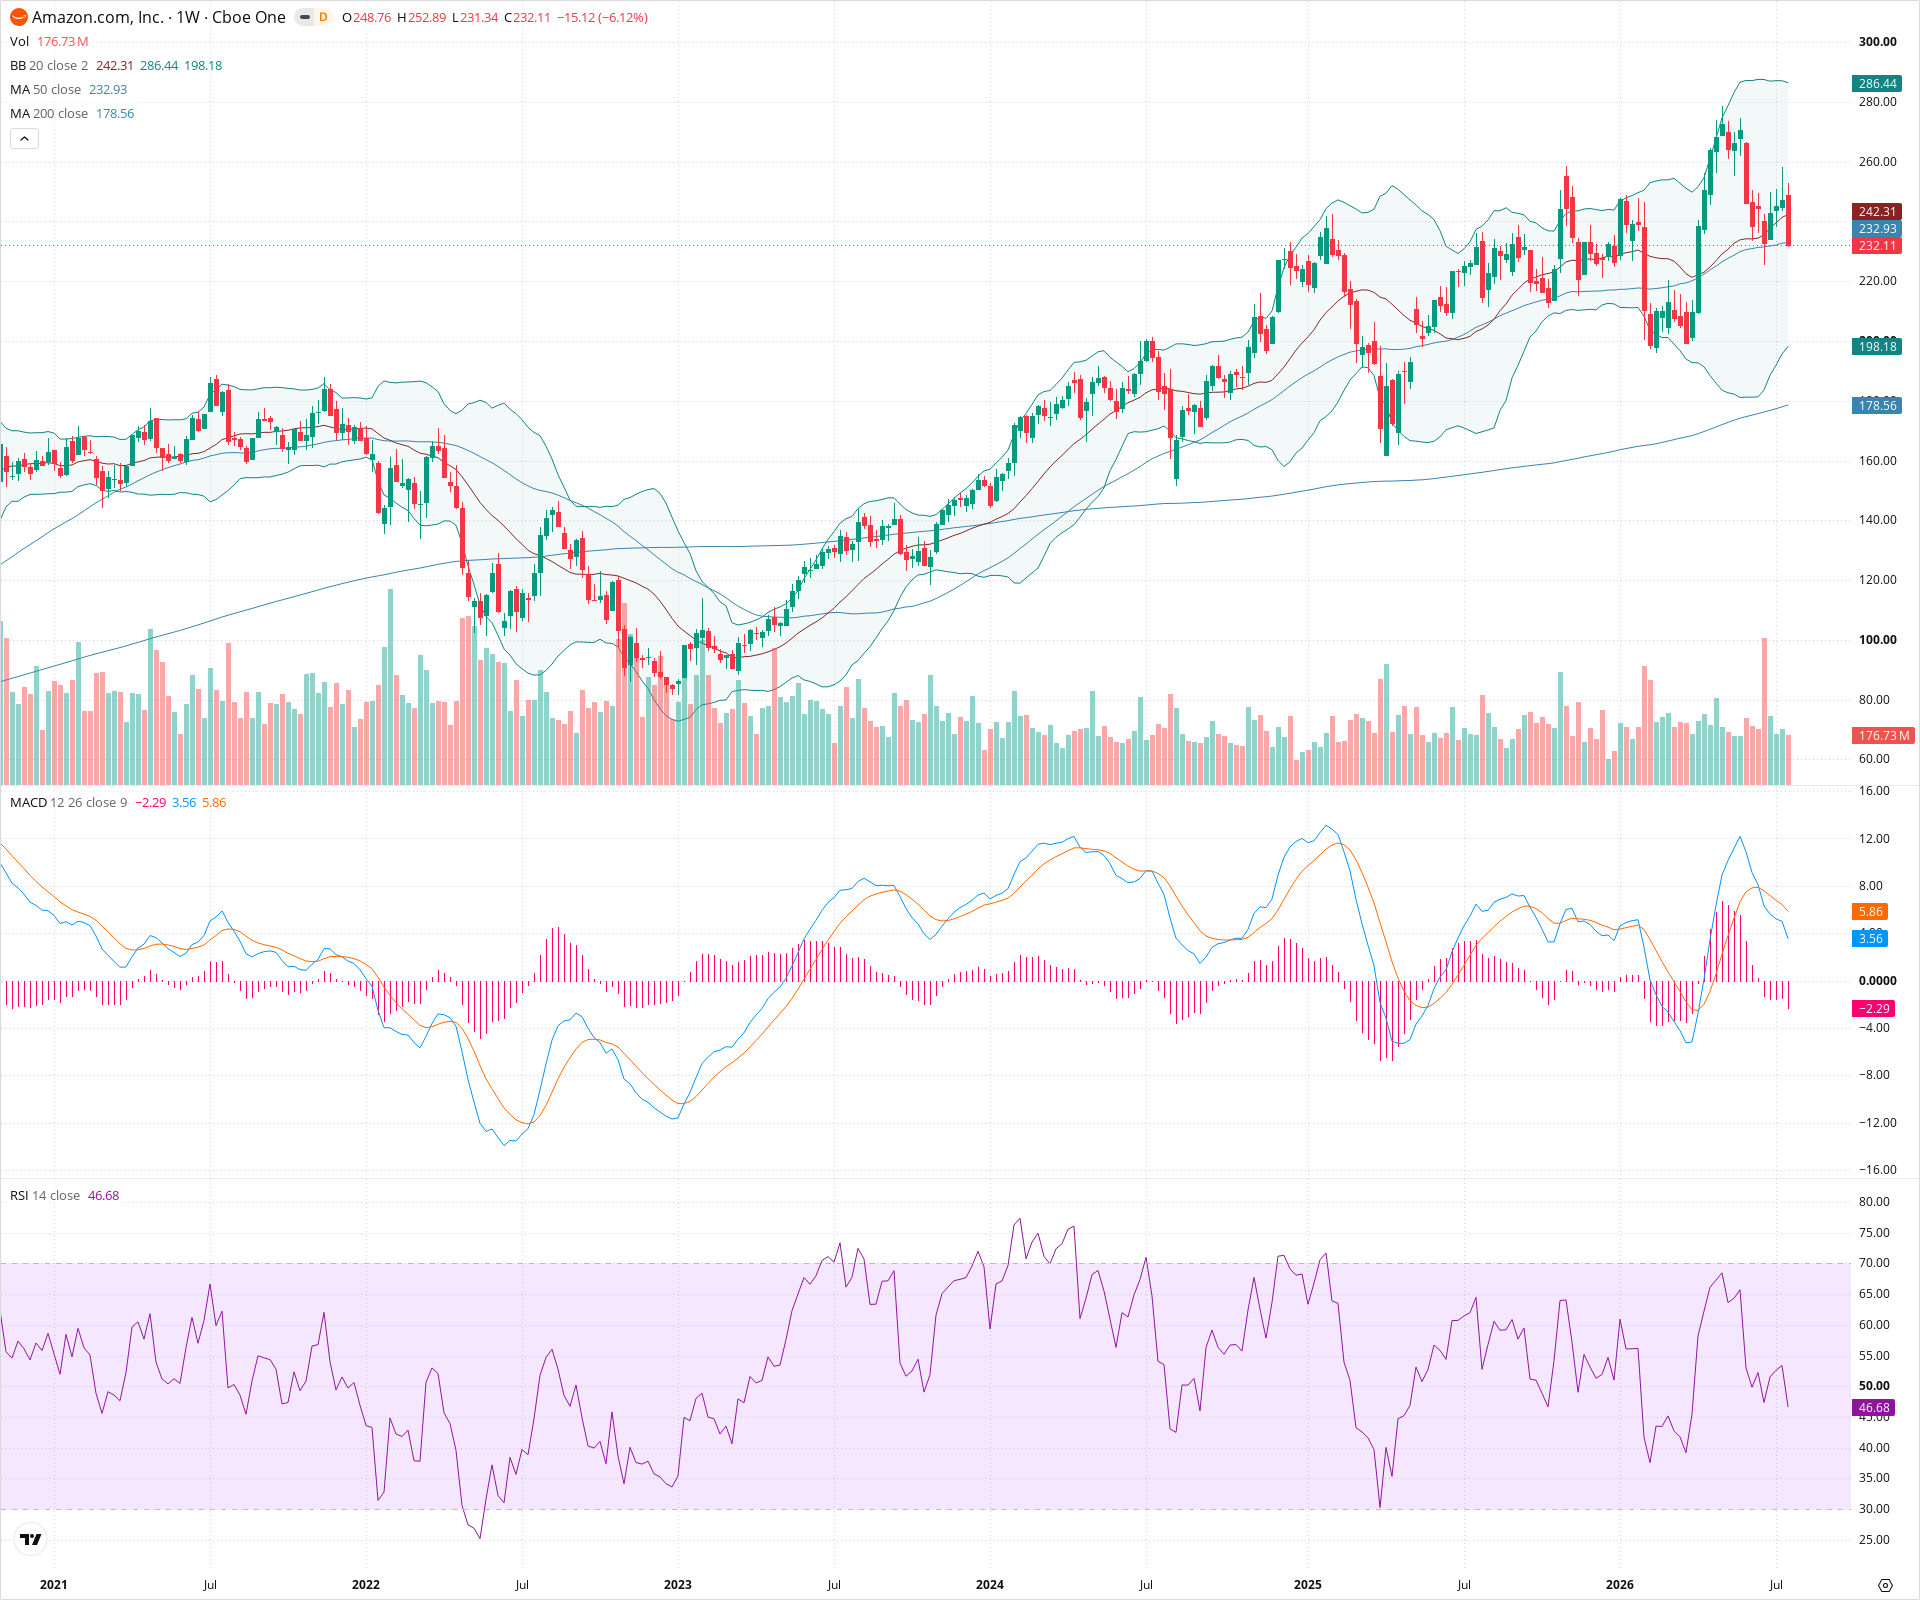
AMZN Weekly Technical Analysis
Amazon.com Inc.
Global e-commerce leader with major cloud services via Amazon Web Services.
AMZN Technical Analysis Summary
AMZN is currently experiencing a short-term bearish correction following a potential double top near the $250 level. Momentum indicators (MACD and RSI) confirm this near-term weakness. However, the long-term trend remains firmly bullish as long as the stock holds above the major structural support zone around $195-$205 and the rising 50/200-week moving averages.
Included In Lists
Related Tickers of Interest
AMZN Weekly Chart
Sentiment
Short-term Sentiment (days to weeks): Bearish
Price is breaking down from a recent consolidation, MACD is crossing bearishly with negative histogram momentum, and RSI has dropped below 50, indicating short-term weakness.
Long-term Sentiment (weeks to months): Bullish
Despite the short-term pullback, price remains above the rising 200-week SMA and 50-week SMA, and the broader macro structure of higher highs and higher lows remains intact since early 2023.
Report Metadata
- Timeframe: weekly
- Generated at: 2026-07-25T09:01:53.701Z
- Model: gemini-3.1-pro-preview
Support Price Levels
| Level | Range | Strength | Notes |
|---|---|---|---|
| $200.00 | $195.00 - $205.00 | Strong | Prior major swing high consolidation zone in mid-2025, which should act as strong support on a pullback, roughly aligning with the 50-week SMA. |
| $175.00 | $170.00 - $180.00 | Strong | Major structural swing low from mid-2024 and confluence with the rising 200-week SMA. |
Resistance Price Levels
| Level | Range | Strength | Notes |
|---|---|---|---|
| $245.00 | $240.00 - $250.00 | Strong | Recent all-time high consolidation area and rejection point, marked by a multi-top formation. |
| $285.00 | $280.00 - $290.00 | Weak | Psychological resistance area above current all-time highs; no prior price history. |
Potential Chart Patterns in Formation
| Strength | Pattern | Signal | Target | Details |
|---|---|---|---|---|
| Strong | Double Top (Potential) | Bearish | $200.00 | A potential double top formation at the ~$250 level. The recent breakdown below the middle consolidation increases the likelihood of a deeper correction. |
| Strong | Uptrend Channel (Macro) | Bullish | N/A | Since early 2023, the stock has been respecting a broad upward trajectory characterized by higher highs and higher lows. The current pullback is testing the internal trend structure but remains within the macro uptrend. |
Frequently Asked Questions about AMZN
What is the current sentiment for AMZN?
The short-term sentiment for AMZN is currently Bearish because Price is breaking down from a recent consolidation, MACD is crossing bearishly with negative histogram momentum, and RSI has dropped below 50, indicating short-term weakness.. The long-term trend is classified as Bullish.
What are the key support levels for AMZN?
StockDips.AI has identified key support levels for AMZN at $200.00 and $175.00. These levels may represent potential accumulation zones where buying interest could emerge.
Is AMZN in a significant dip or a Value Dip right now?
AMZN has a Value Score of 75/100. It is currently flagged as a significant dip in the Top Dips list. It is also listed as a Value Dip because long-term sentiment is bullish.
View the full interactive analysis on StockDips.AI.