AMZN Monthly Technical Analysis
Amazon.com Inc.
Global e-commerce leader with major cloud services via Amazon Web Services.
AMZN Technical Analysis Summary
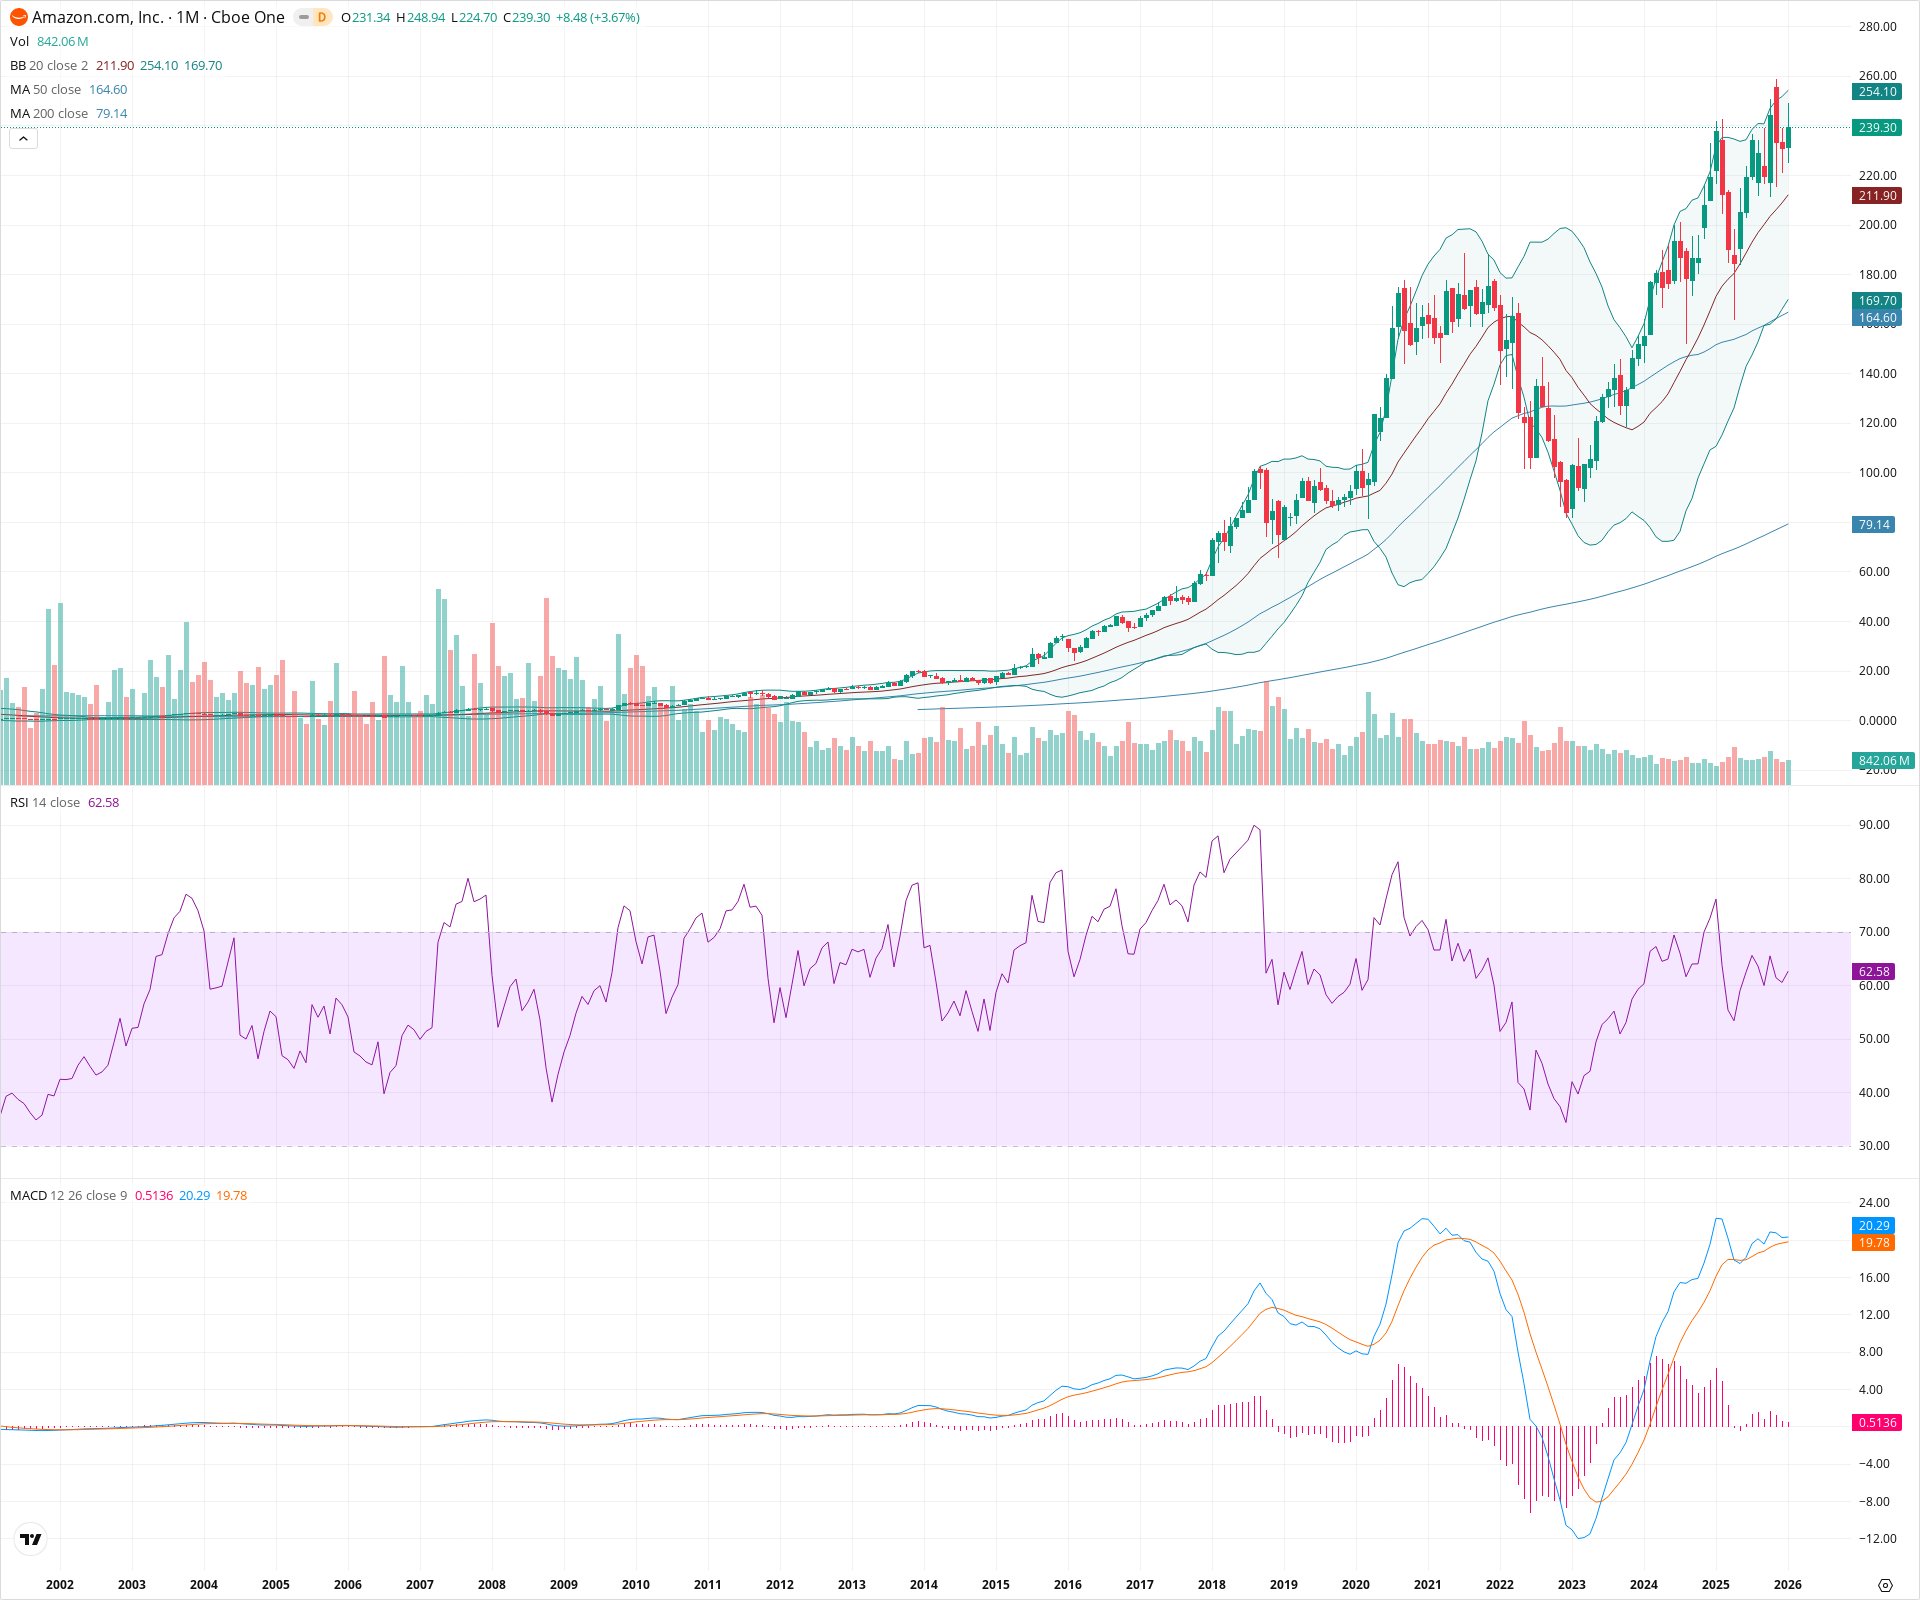
Amazon has definitively resumed its long-term uptrend by breaking out of a large multi-year base to establish new all-time highs. The monthly technical structure is robust, with expanding Bollinger Bands and bullish alignment of all major moving averages suggesting continued momentum. While the price is approaching the upper Bollinger Band, the underlying trend remains strongly positive with major support now established at the previous breakout level near 188.
Included In Lists
Related Tickers of Interest
AMZN Monthly Chart
Sentiment
Short-term Sentiment (days to weeks): Bullish
Price is trading near all-time highs with strong upward momentum, positioned well above the rising 20-month SMA and supported by a positive MACD histogram.
Long-term Sentiment (weeks to months): Bullish
The stock has confirmed a secular breakout from a multi-year consolidation base. Moving averages are stacked in a bullish configuration (20 > 50 > 200), and RSI is in bullish territory without being extreme.
Report Metadata
- Timeframe: monthly
- Generated at: 2026-02-02T05:11:35.312Z
- Model: gemini-3-pro-preview
Support Price Levels
| Level | Range | Strength | Notes |
|---|---|---|---|
| $211.00 | $210.00 - $212.00 | Weak | Dynamic support provided by the 20-month SMA (Bollinger Band basis). |
| $185.00 | $180.00 - $190.00 | Strong | Former major resistance (2021 all-time highs) now acting as the primary secular support zone. |
| $162.50 | $160.00 - $165.00 | Strong | Confluence of the 50-month SMA and the consolidation lows prior to the recent breakout. |
Resistance Price Levels
| Level | Range | Strength | Notes |
|---|---|---|---|
| $251.05 | $248.00 - $254.10 | Weak | Current monthly high and the Upper Bollinger Band level. |
| $295.00 | $290.00 - $300.00 | Weak | Psychological round number and theoretical measured move target from the cup pattern. |
Potential Chart Patterns in Formation
| Strength | Pattern | Signal | Target | Details |
|---|---|---|---|---|
| Strong | Rounding Bottom / Cup Breakout | Bullish | $295.00 | A large multi-year recovery structure starting from the 2021 highs, bottoming in 2022-2023, and breaking out to new highs in 2024. |
Frequently Asked Questions about AMZN
What is the current sentiment for AMZN?
The short-term sentiment for AMZN is currently Bullish because Price is trading near all-time highs with strong upward momentum, positioned well above the rising 20-month SMA and supported by a positive MACD histogram.. The long-term trend is classified as Bullish.
What are the key support levels for AMZN?
StockDips.AI has identified key support levels for AMZN at $211.00 and $185.00. These levels may represent potential accumulation zones where buying interest could emerge.
Is AMZN in a significant dip or a Value Dip right now?
AMZN has a Value Score of 75/100. It is currently flagged as a significant dip in the Top Dips list. It is also listed as a Value Dip because long-term sentiment is bullish.
View the full interactive analysis on StockDips.AI.