ARM Weekly Technical Analysis
Arm Holdings PLC
Designs ARM-based CPU architectures widely used in mobile devices, embedded systems, and increasingly data-center and AI applications.
ARM Technical Analysis Summary
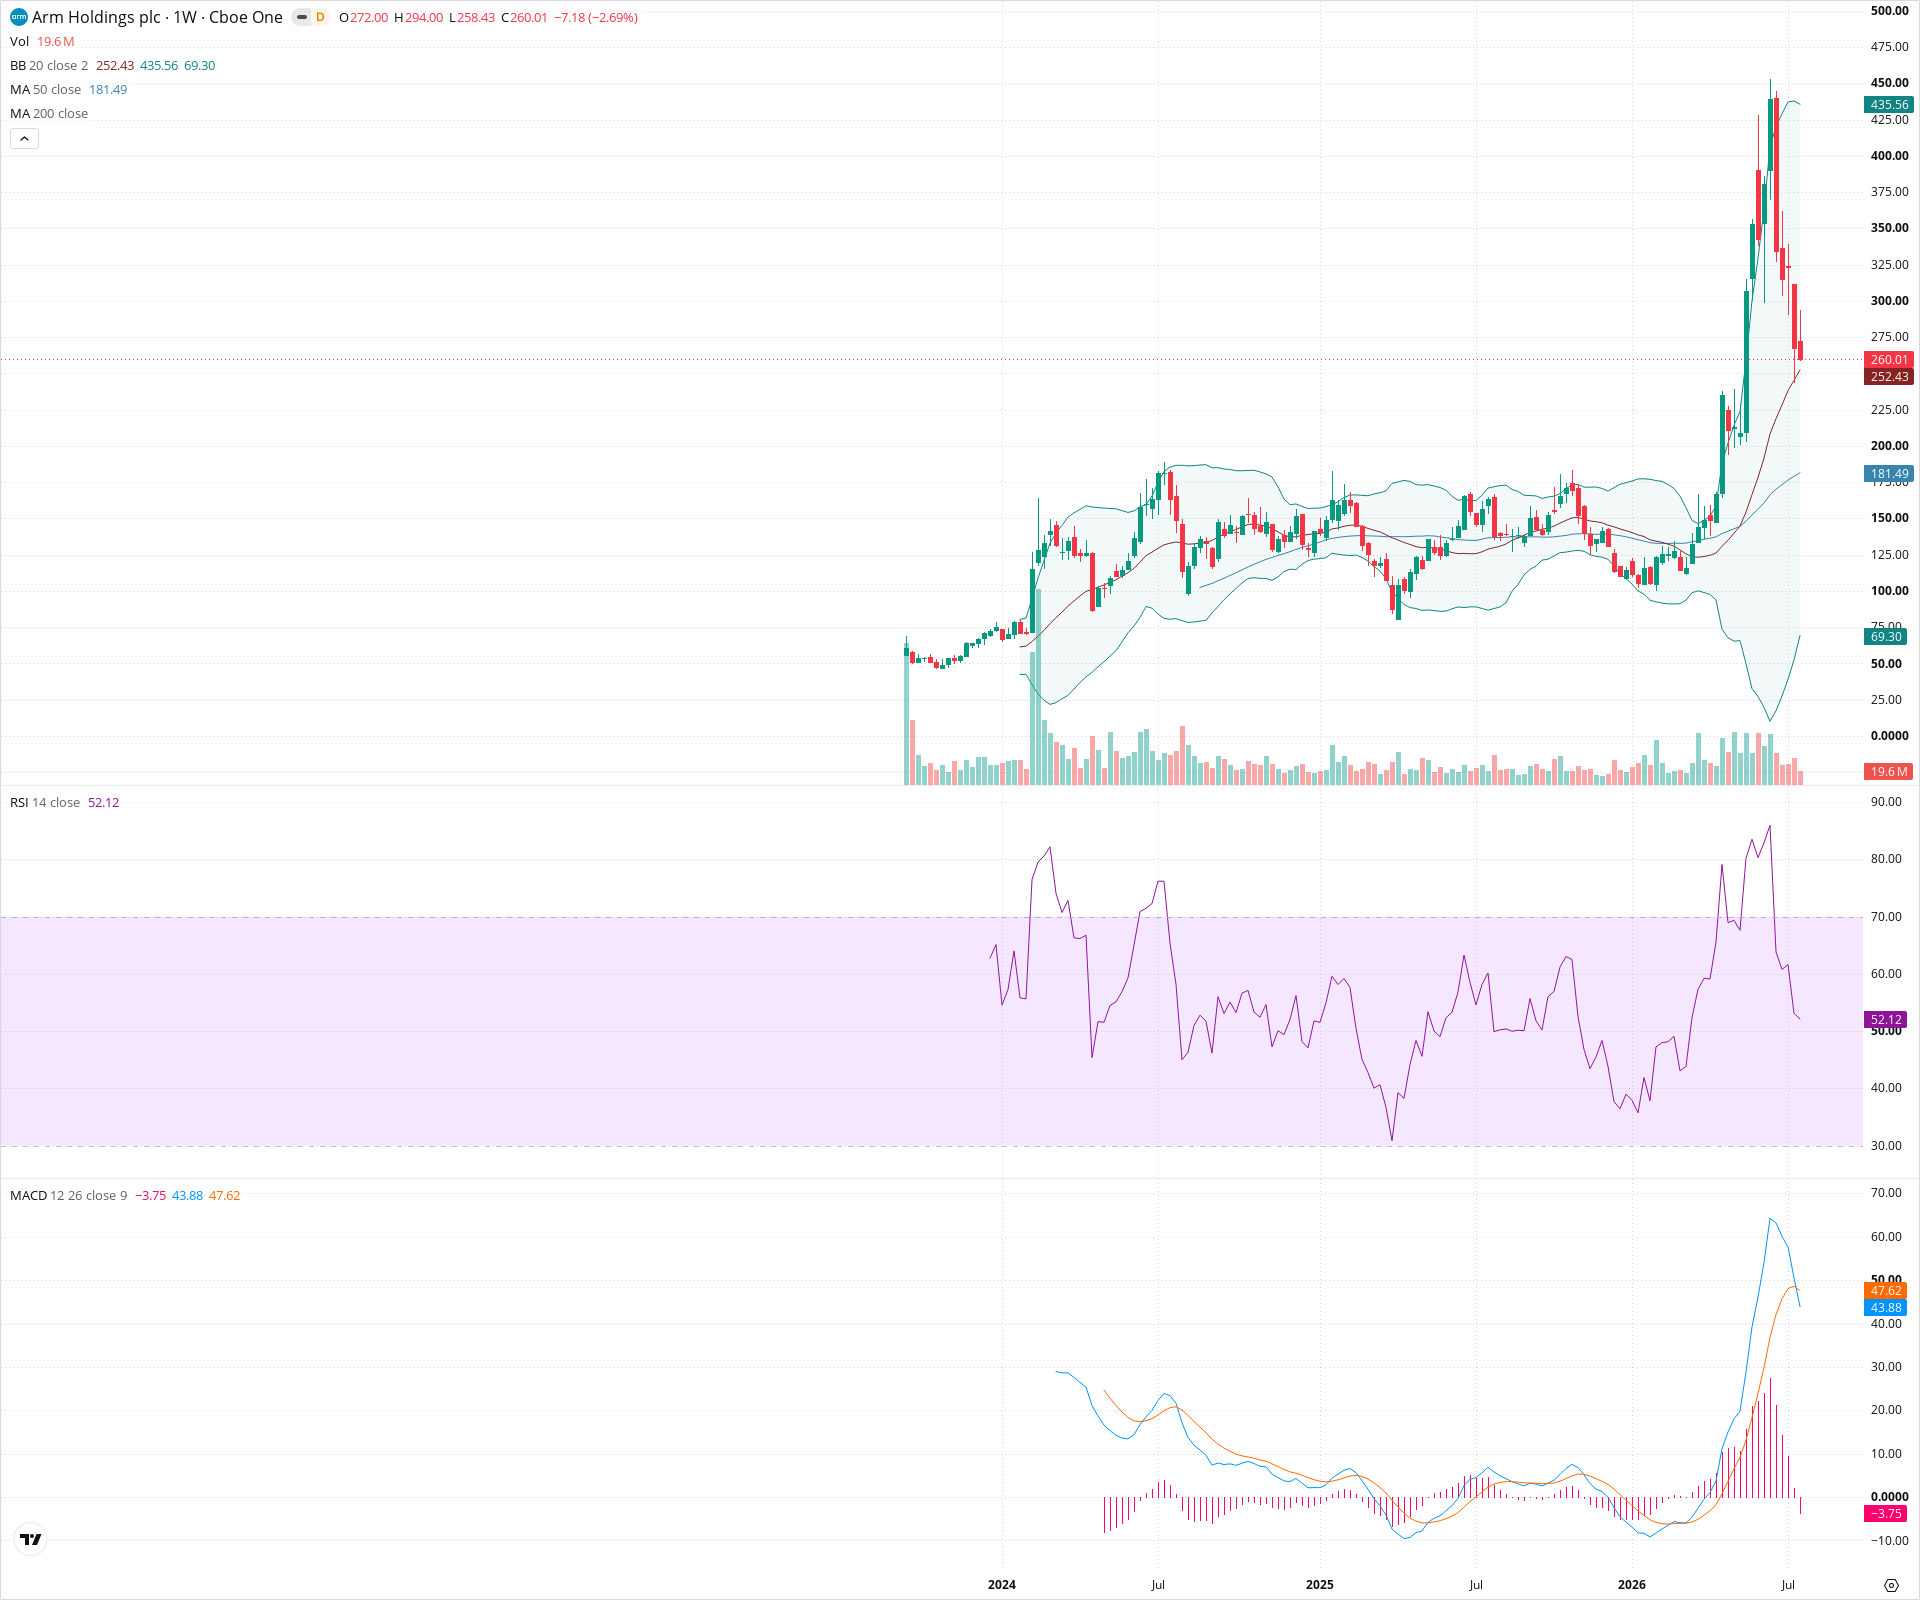
ARM has experienced a classic blow-off top following a parabolic multi-month advance, resulting in extreme short-term bearish momentum and a sharp mean-reversion correction. While the near-term technical picture is highly defensive with bearish MACD crosses and plummeting RSI, the long-term trend remains intact as long as major structural support in the 170-190 zone (near the 50-week SMA) is maintained. The current price is testing initial, weaker support near the 20-week SMA.
Included In Lists
Related Tickers of Interest
ARM Weekly Chart
Sentiment
Short-term Sentiment (days to weeks): Bearish
Price is in a steep, high-momentum decline following a parabolic top. MACD has crossed bearishly and histogram is expanding downwards, while RSI is falling sharply toward the 50 neutral line.
Long-term Sentiment (weeks to months): Bullish
Despite the severe short-term correction, price remains significantly above the rising 50-week SMA, and the broader multi-year structure is still an established uptrend following a major base breakout.
Report Metadata
- Timeframe: weekly
- Generated at: 2026-07-25T09:05:57.301Z
- Model: gemini-3.1-pro-preview
Support Price Levels
| Level | Range | Strength | Notes |
|---|---|---|---|
| $242.50 | $225.00 - $260.00 | Weak | Immediate area around the 20-week SMA and some prior choppy price action before the final vertical ascent. |
| $180.00 | $170.00 - $190.00 | Strong | Major confluence zone containing the rising 50-week SMA and the prior primary breakout level from the long consolidation base. |
Resistance Price Levels
| Level | Range | Strength | Notes |
|---|---|---|---|
| $362.50 | $350.00 - $375.00 | Weak | Potential minor resistance area from previous consolidation during the initial leg of the massive run-up. |
| $475.00 | $450.00 - $500.00 | Strong | The blow-off top all-time high zone. |
Potential Chart Patterns in Formation
| Strength | Pattern | Signal | Target | Details |
|---|---|---|---|---|
| Strong | Blow-off Top | Bearish | N/A | A massive, near-vertical price advance on expanding volume followed by a sharp, high-volume reversal, leaving a long upper wick and large red candles. |
Frequently Asked Questions about ARM
What is the current sentiment for ARM?
The short-term sentiment for ARM is currently Bearish because Price is in a steep, high-momentum decline following a parabolic top. MACD has crossed bearishly and histogram is expanding downwards, while RSI is falling sharply toward the 50 neutral line.. The long-term trend is classified as Bullish.
What are the key support levels for ARM?
StockDips.AI has identified key support levels for ARM at $242.50 and $180.00. These levels may represent potential accumulation zones where buying interest could emerge.
Is ARM in a significant dip or a Value Dip right now?
ARM has a Value Score of 67/100. It is not currently flagged as a significant dip in the Top Dips list. It is not listed as a Value Dip because the long-term sentiment or value-score threshold does not qualify.
View the full interactive analysis on StockDips.AI.