ARM Daily Technical Analysis
Arm Holdings PLC
Designs ARM-based CPU architectures widely used in mobile devices, embedded systems, and increasingly data-center and AI applications.
ARM Technical Analysis Summary
ARM has suffered a severe technical breakdown following a massive parabolic run, confirming a large Head and Shoulders topping pattern. Short-term momentum is extremely negative, with price slicing through the 50-day SMA and MACD accelerating downward. Long-term investors should watch for potential stabilization in the 185-210 zone, where structural support meets the rising 200-day moving average, to determine if the primary uptrend can be salvaged.
Included In Lists
Related Tickers of Interest
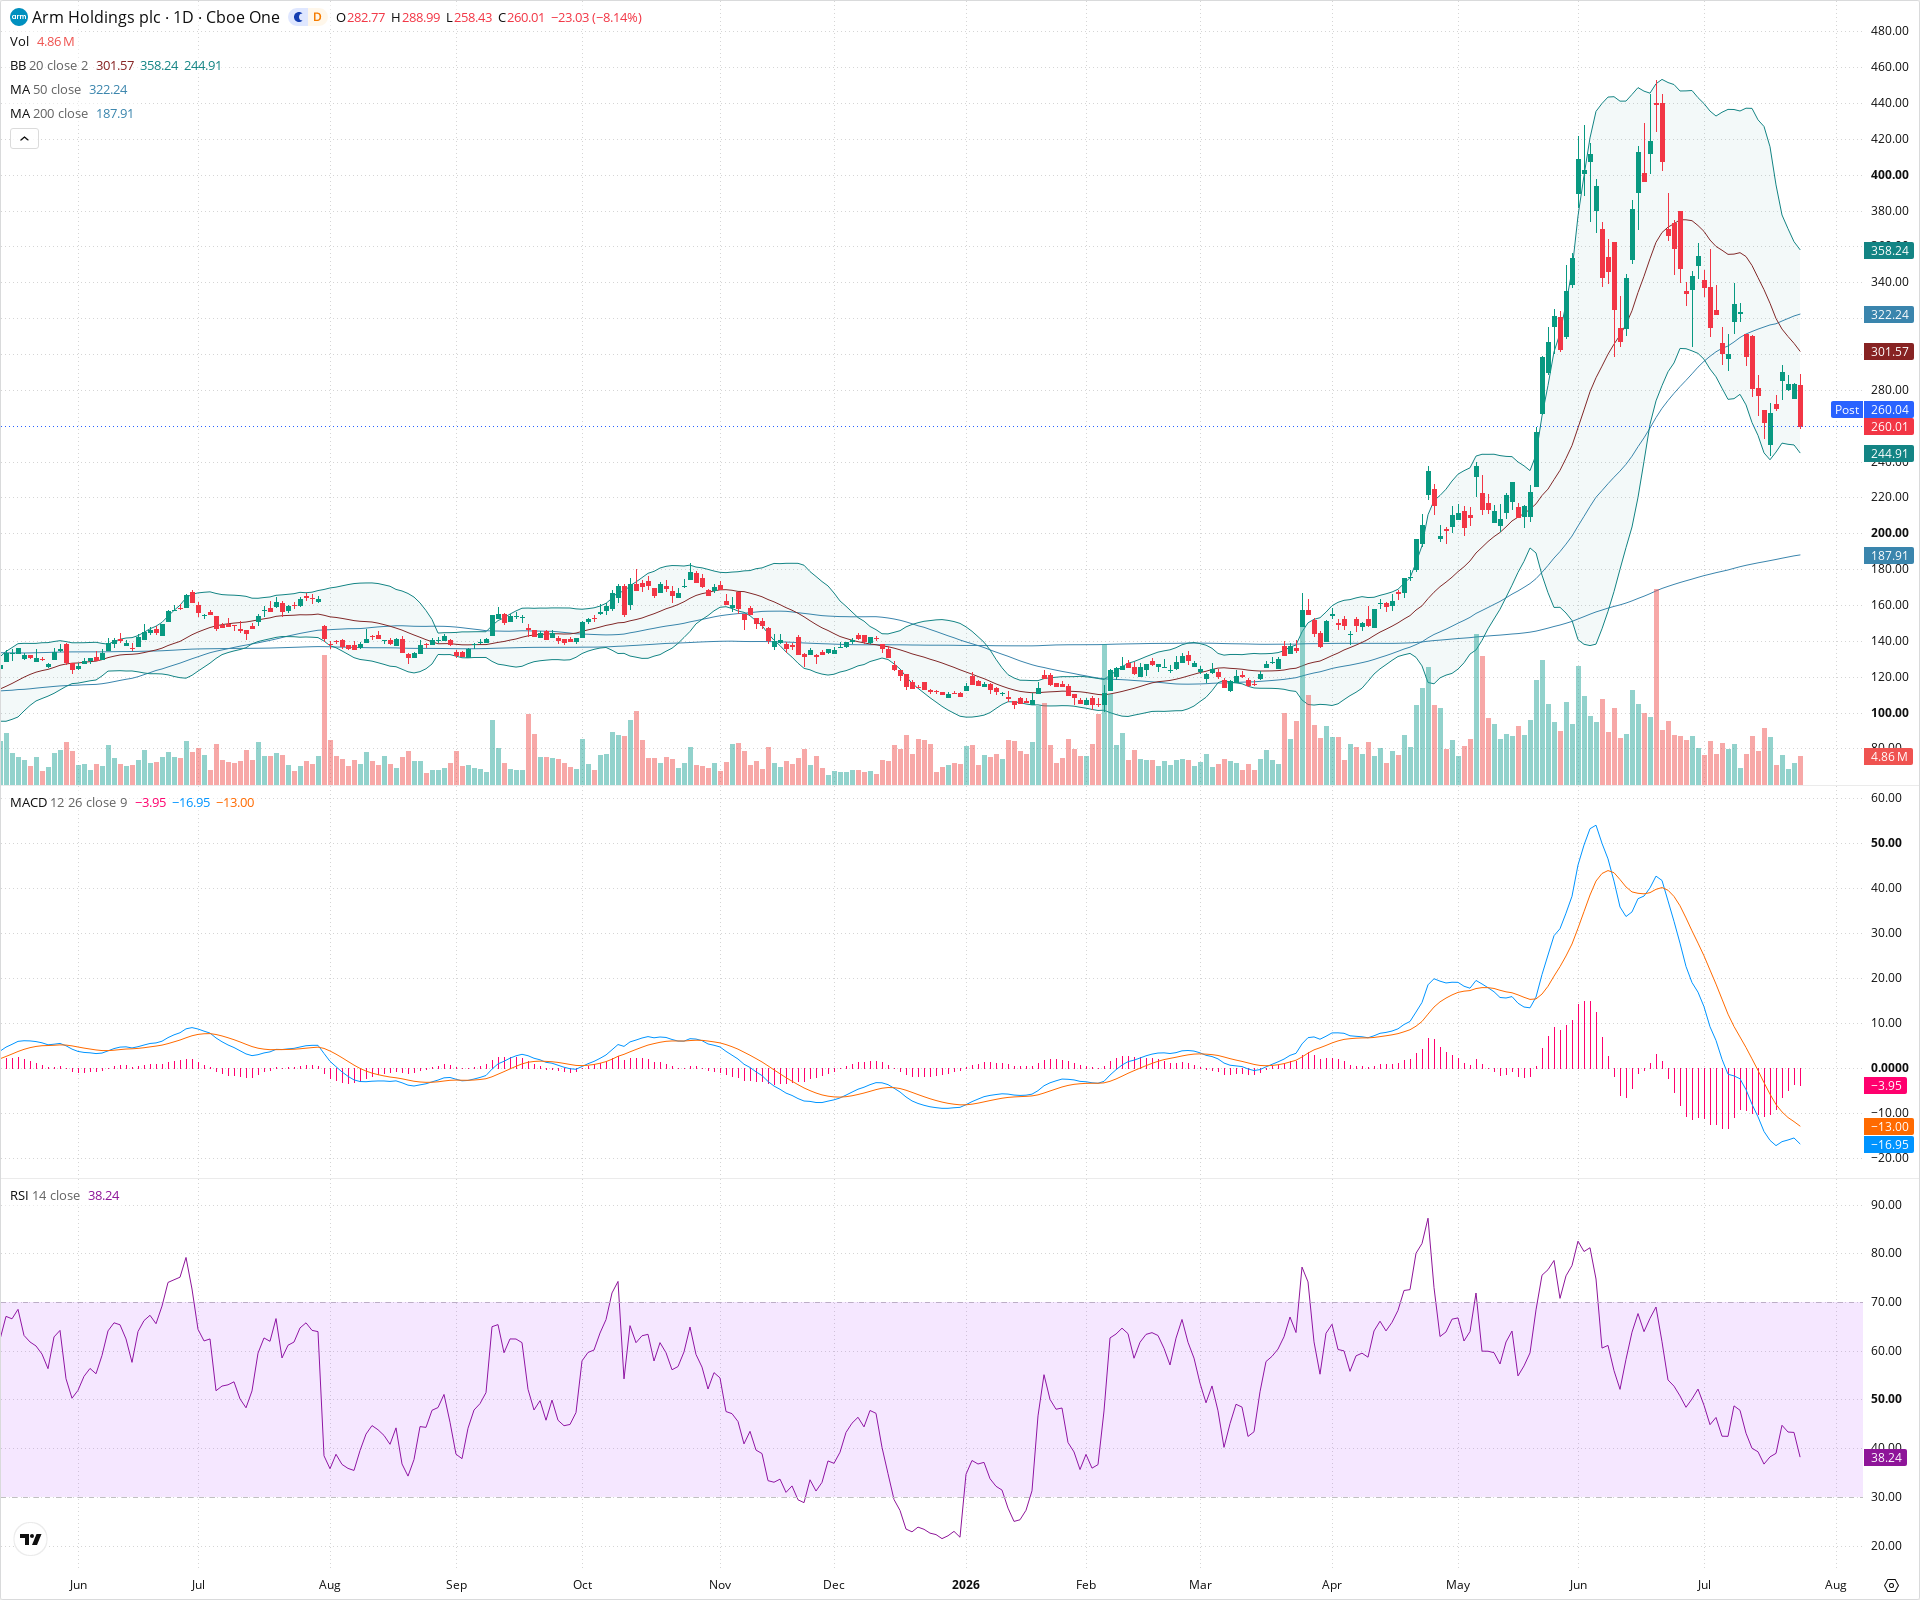
ARM Daily Chart
Sentiment
Short-term Sentiment (days to weeks): Bearish
Price is in a steep, unconfirmed downtrend, having decisively broken below the 50-day SMA. It is currently riding the lower Bollinger Band with RSI dropping sharply toward oversold, and MACD showing an expanding negative histogram, confirming strong downside momentum.
Long-term Sentiment (weeks to months): Neutral
While experiencing a severe short-term correction, the price remains significantly above the rising 200-day SMA. The primary long-term uptrend structure is technically intact until the 200-day SMA is breached, but the magnitude of the current drop warrants caution.
Report Metadata
- Timeframe: daily
- Generated at: 2026-07-24T21:17:30.498Z
- Model: gemini-3.1-pro-preview
Support Price Levels
| Level | Range | Strength | Notes |
|---|---|---|---|
| $230.00 | $220.00 - $240.00 | Weak | Area of minor consolidation just prior to the massive parabolic gap and run-up in May. |
| $195.00 | $185.00 - $205.00 | Strong | Major prior consolidation/breakout zone from earlier in the year, coinciding with the current trajectory of the rising 200-day SMA. |
Resistance Price Levels
| Level | Range | Strength | Notes |
|---|---|---|---|
| $320.00 | $310.00 - $330.00 | Strong | The recently broken 50-day SMA currently resides in this area, which will likely act as dynamic resistance on any relief rallies. |
| $390.00 | $380.00 - $400.00 | Strong | A significant recent lower high (right shoulder area) established during the current downtrend. |
Potential Chart Patterns in Formation
| Strength | Pattern | Signal | Target | Details |
|---|---|---|---|---|
| Strong | Head and Shoulders Top | Bearish | $200.00 | A large topping formation with a peak near 470 flanked by lower highs. The price has decisively broken the structural neckline area around 300, confirming the reversal pattern. |
| Strong | Parabolic Curve Breakdown | Bearish | N/A | The near-vertical ascent from May to June has broken its trend and the 50-SMA, resulting in a rapid, mean-reverting correction typical of broken parabolic moves. |
Frequently Asked Questions about ARM
What is the current sentiment for ARM?
The short-term sentiment for ARM is currently Bearish because Price is in a steep, unconfirmed downtrend, having decisively broken below the 50-day SMA. It is currently riding the lower Bollinger Band with RSI dropping sharply toward oversold, and MACD showing an expanding negative histogram, confirming strong downside momentum.. The long-term trend is classified as Neutral.
What are the key support levels for ARM?
StockDips.AI has identified key support levels for ARM at $230.00 and $195.00. These levels may represent potential accumulation zones where buying interest could emerge.
Is ARM in a significant dip or a Value Dip right now?
ARM has a Value Score of 67/100. It is not currently flagged as a significant dip in the Top Dips list. It is not listed as a Value Dip because the long-term sentiment or value-score threshold does not qualify.
View the full interactive analysis on StockDips.AI.