ARM Monthly Technical Analysis
Arm Holdings PLC
Designs ARM-based CPU architectures widely used in mobile devices, embedded systems, and increasingly data-center and AI applications.
ARM Technical Analysis Summary
ARM is undergoing a significant mean-reversion correction on the monthly timeframe, having lost the support of its 20-month SMA. The immediate momentum is bearish as price seeks support near the lower Bollinger Band and the $100 psychological level. Long-term investors should watch for stabilization near the $75–$85 secular breakout zone if the $100 level fails to hold.
Included In Lists
Related Tickers of Interest
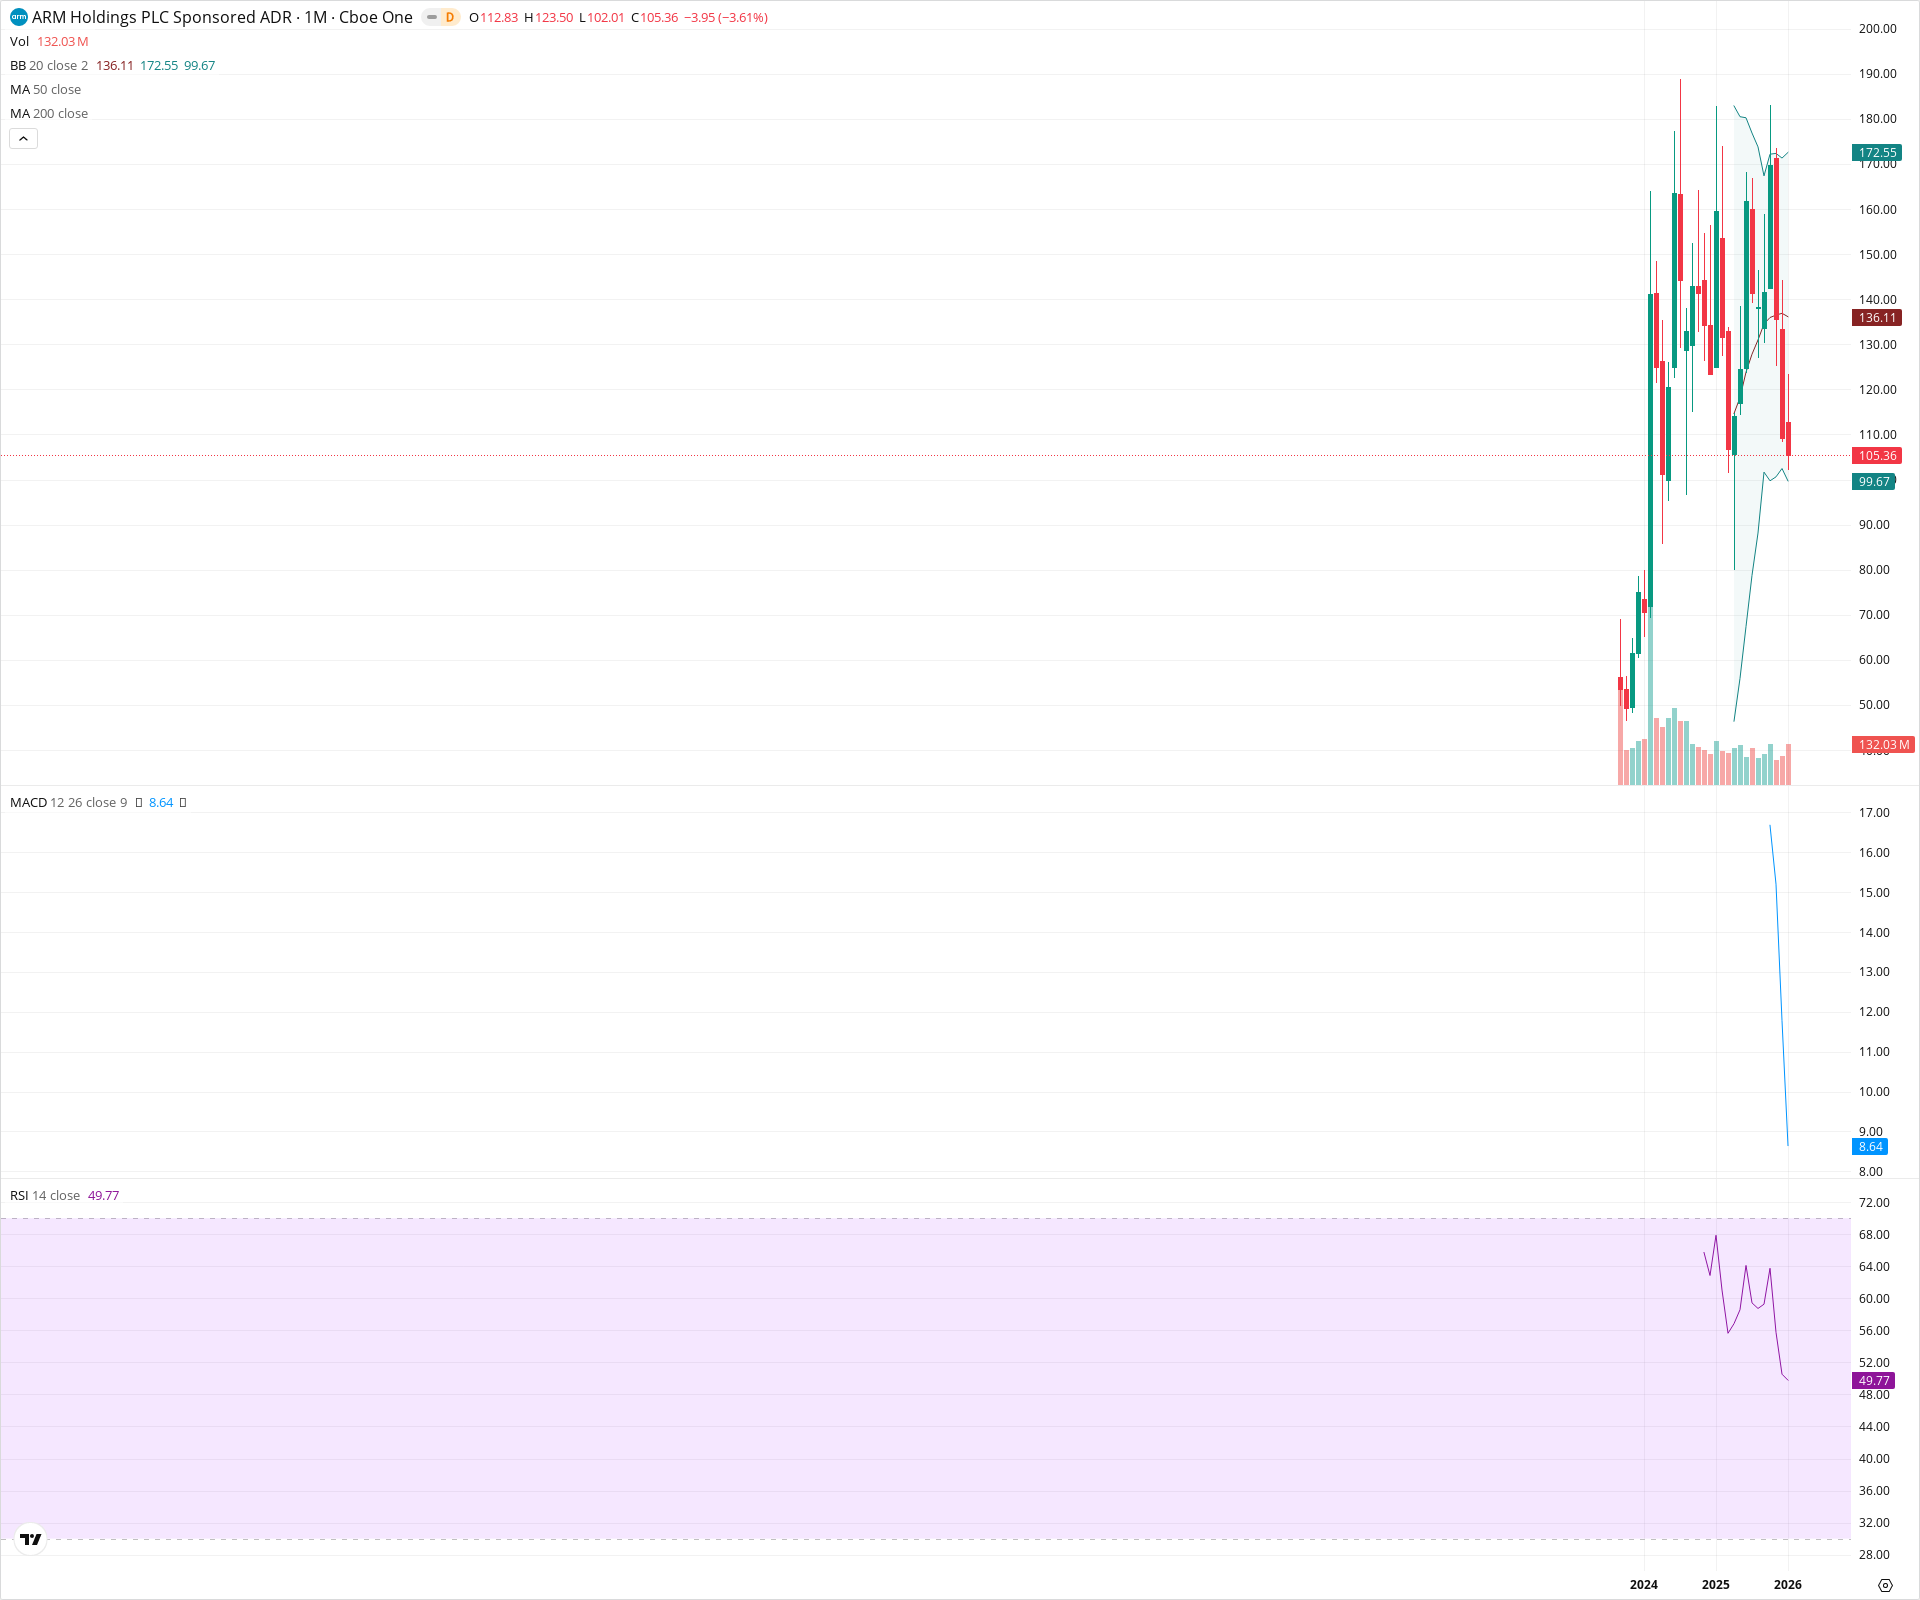
ARM Monthly Chart
Sentiment
Short-term Sentiment (days to weeks): Bearish
Price has broken below the 20-period SMA (136.11) and is trending aggressively downwards. The current monthly candle is red, showing continued selling pressure towards the lower Bollinger Band.
Long-term Sentiment (weeks to months): Neutral
While the stock remains above its initial IPO base structure (~$75), the parabolic uptrend has broken. The RSI has reset to the 50 midline and MACD momentum is rapidly decaying, signaling a transition from a strong bull market to a consolidation or correction regime.
Report Metadata
- Timeframe: monthly
- Generated at: 2026-02-02T05:11:51.210Z
- Model: gemini-3-pro-preview
Support Price Levels
| Level | Range | Strength | Notes |
|---|---|---|---|
| $99.84 | $99.67 - $100.00 | Strong | Confluence of the Monthly Lower Bollinger Band (99.67) and the psychological $100 round number. |
| $80.00 | $75.00 - $85.00 | Strong | Major structural support zone originating from the post-IPO breakout gap and consolidation base. |
Resistance Price Levels
| Level | Range | Strength | Notes |
|---|---|---|---|
| $138.06 | $136.11 - $140.00 | Strong | The 20-period SMA (Bollinger Basis) has flipped from support to resistance. |
| $181.50 | $175.00 - $188.00 | Strong | All-time high zone and overhead supply from the previous distribution top. |
Potential Chart Patterns in Formation
| Strength | Pattern | Signal | Target | Details |
|---|---|---|---|---|
| Strong | Mean Reversion / Deep Correction | Bearish | $99.67 | After a parabolic extension well above the Bollinger Bands, price is reverting sharply to test the lower volatility band. |
| Strong | Bearish RSI Divergence | Bearish | N/A | Price formed a higher high around 188.00 while RSI formed a lower high, indicating trend exhaustion prior to the current breakdown. |
Frequently Asked Questions about ARM
What is the current sentiment for ARM?
The short-term sentiment for ARM is currently Bearish because Price has broken below the 20-period SMA (136.11) and is trending aggressively downwards. The current monthly candle is red, showing continued selling pressure towards the lower Bollinger Band.. The long-term trend is classified as Neutral.
What are the key support levels for ARM?
StockDips.AI has identified key support levels for ARM at $99.84 and $80.00. These levels may represent potential accumulation zones where buying interest could emerge.
Is ARM in a significant dip or a Value Dip right now?
ARM has a Value Score of 67/100. It is not currently flagged as a significant dip in the Top Dips list. It is not listed as a Value Dip because the long-term sentiment or value-score threshold does not qualify.
View the full interactive analysis on StockDips.AI.