ASML Weekly Technical Analysis
ASML Holding
Manufactures advanced lithography machines essential for semiconductor manufacturing.
ASML Technical Analysis Summary
ASML exhibits a dominant long-term uptrend, highlighted by a massive breakout from a multi-year base and a subsequent parabolic extension. Currently, the stock is undergoing a necessary and sharp short-term consolidation to bleed off extreme overbought momentum. While short-term action is corrective, the broader structural trend remains firmly bullish as long as major moving averages are maintained.
Included In Lists
Related Tickers of Interest
ASML Weekly Chart
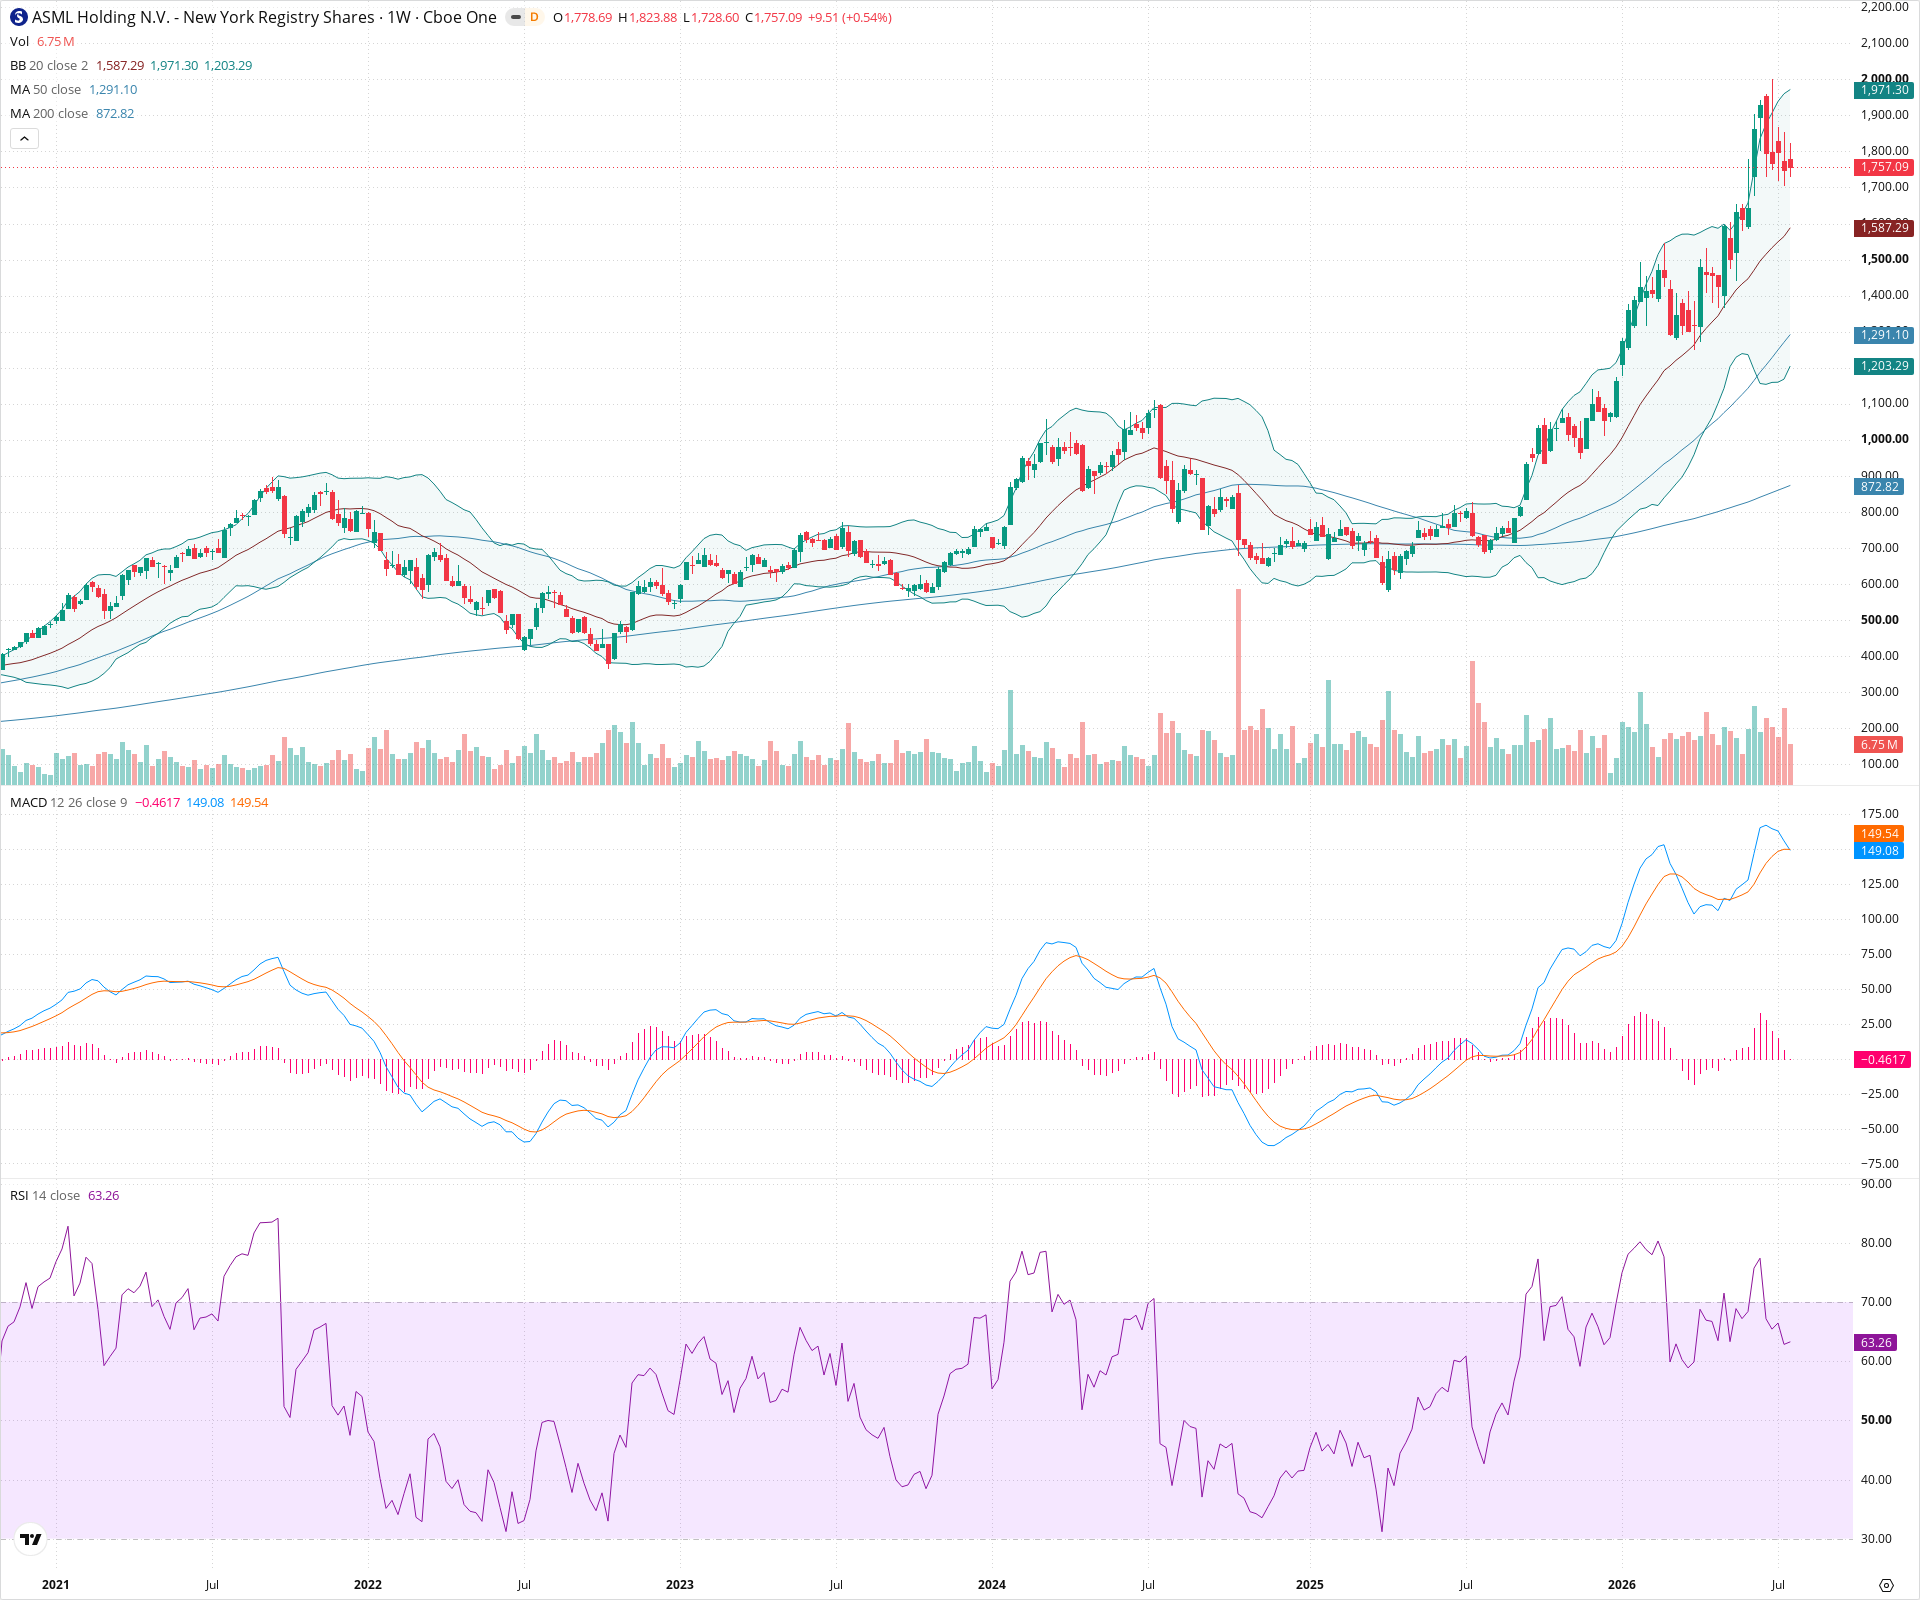
Sentiment
Short-term Sentiment (days to weeks): Neutral
Price is currently experiencing a sharp pullback after a steep, near-parabolic advance. The MACD histogram is declining and RSI is hooking down from overbought levels, indicating short-term momentum is cooling.
Long-term Sentiment (weeks to months): Bullish
The stock remains in a powerful secular uptrend, trading well above steeply rising 50-week and 200-week SMAs following a massive breakout from a multi-year consolidation base.
Report Metadata
- Timeframe: weekly
- Generated at: 2026-07-25T09:03:57.498Z
- Model: gemini-3.1-pro-preview
Support Price Levels
| Level | Range | Strength | Notes |
|---|---|---|---|
| $1,450.00 | $1,400.00 - $1,500.00 | Weak | Initial support zone based on a brief consolidation area during the recent parabolic run-up. |
| $1,300.00 | $1,250.00 - $1,350.00 | Strong | Major structural support zone; area of prior consolidation and confluence with the rapidly rising 50-week SMA. |
Resistance Price Levels
| Level | Range | Strength | Notes |
|---|---|---|---|
| $2,000.00 | $1,950.00 - $2,050.00 | Strong | Recent all-time high zone; weekly candles show long upper wicks indicating strong rejection and taking of profits. |
Potential Chart Patterns in Formation
| Strength | Pattern | Signal | Target | Details |
|---|---|---|---|---|
| Strong | Parabolic Advance and Mean Reversion | Neutral | N/A | The stock experienced a near-vertical price ascent from late 2023 into mid-2024, pushing indicators into extreme territory. The current price action represents a sharp mean-reversion pullback as the market digests these massive gains. |
Frequently Asked Questions about ASML
What is the current sentiment for ASML?
The short-term sentiment for ASML is currently Neutral because Price is currently experiencing a sharp pullback after a steep, near-parabolic advance. The MACD histogram is declining and RSI is hooking down from overbought levels, indicating short-term momentum is cooling.. The long-term trend is classified as Bullish.
What are the key support levels for ASML?
StockDips.AI has identified key support levels for ASML at $1,450.00 and $1,300.00. These levels may represent potential accumulation zones where buying interest could emerge.
Is ASML in a significant dip or a Value Dip right now?
ASML has a Value Score of 67/100. It is not currently flagged as a significant dip in the Top Dips list. It is not listed as a Value Dip because the long-term sentiment or value-score threshold does not qualify.
View the full interactive analysis on StockDips.AI.