ASML Monthly Technical Analysis
ASML Holding
Manufactures advanced lithography machines essential for semiconductor manufacturing.
ASML Technical Analysis Summary
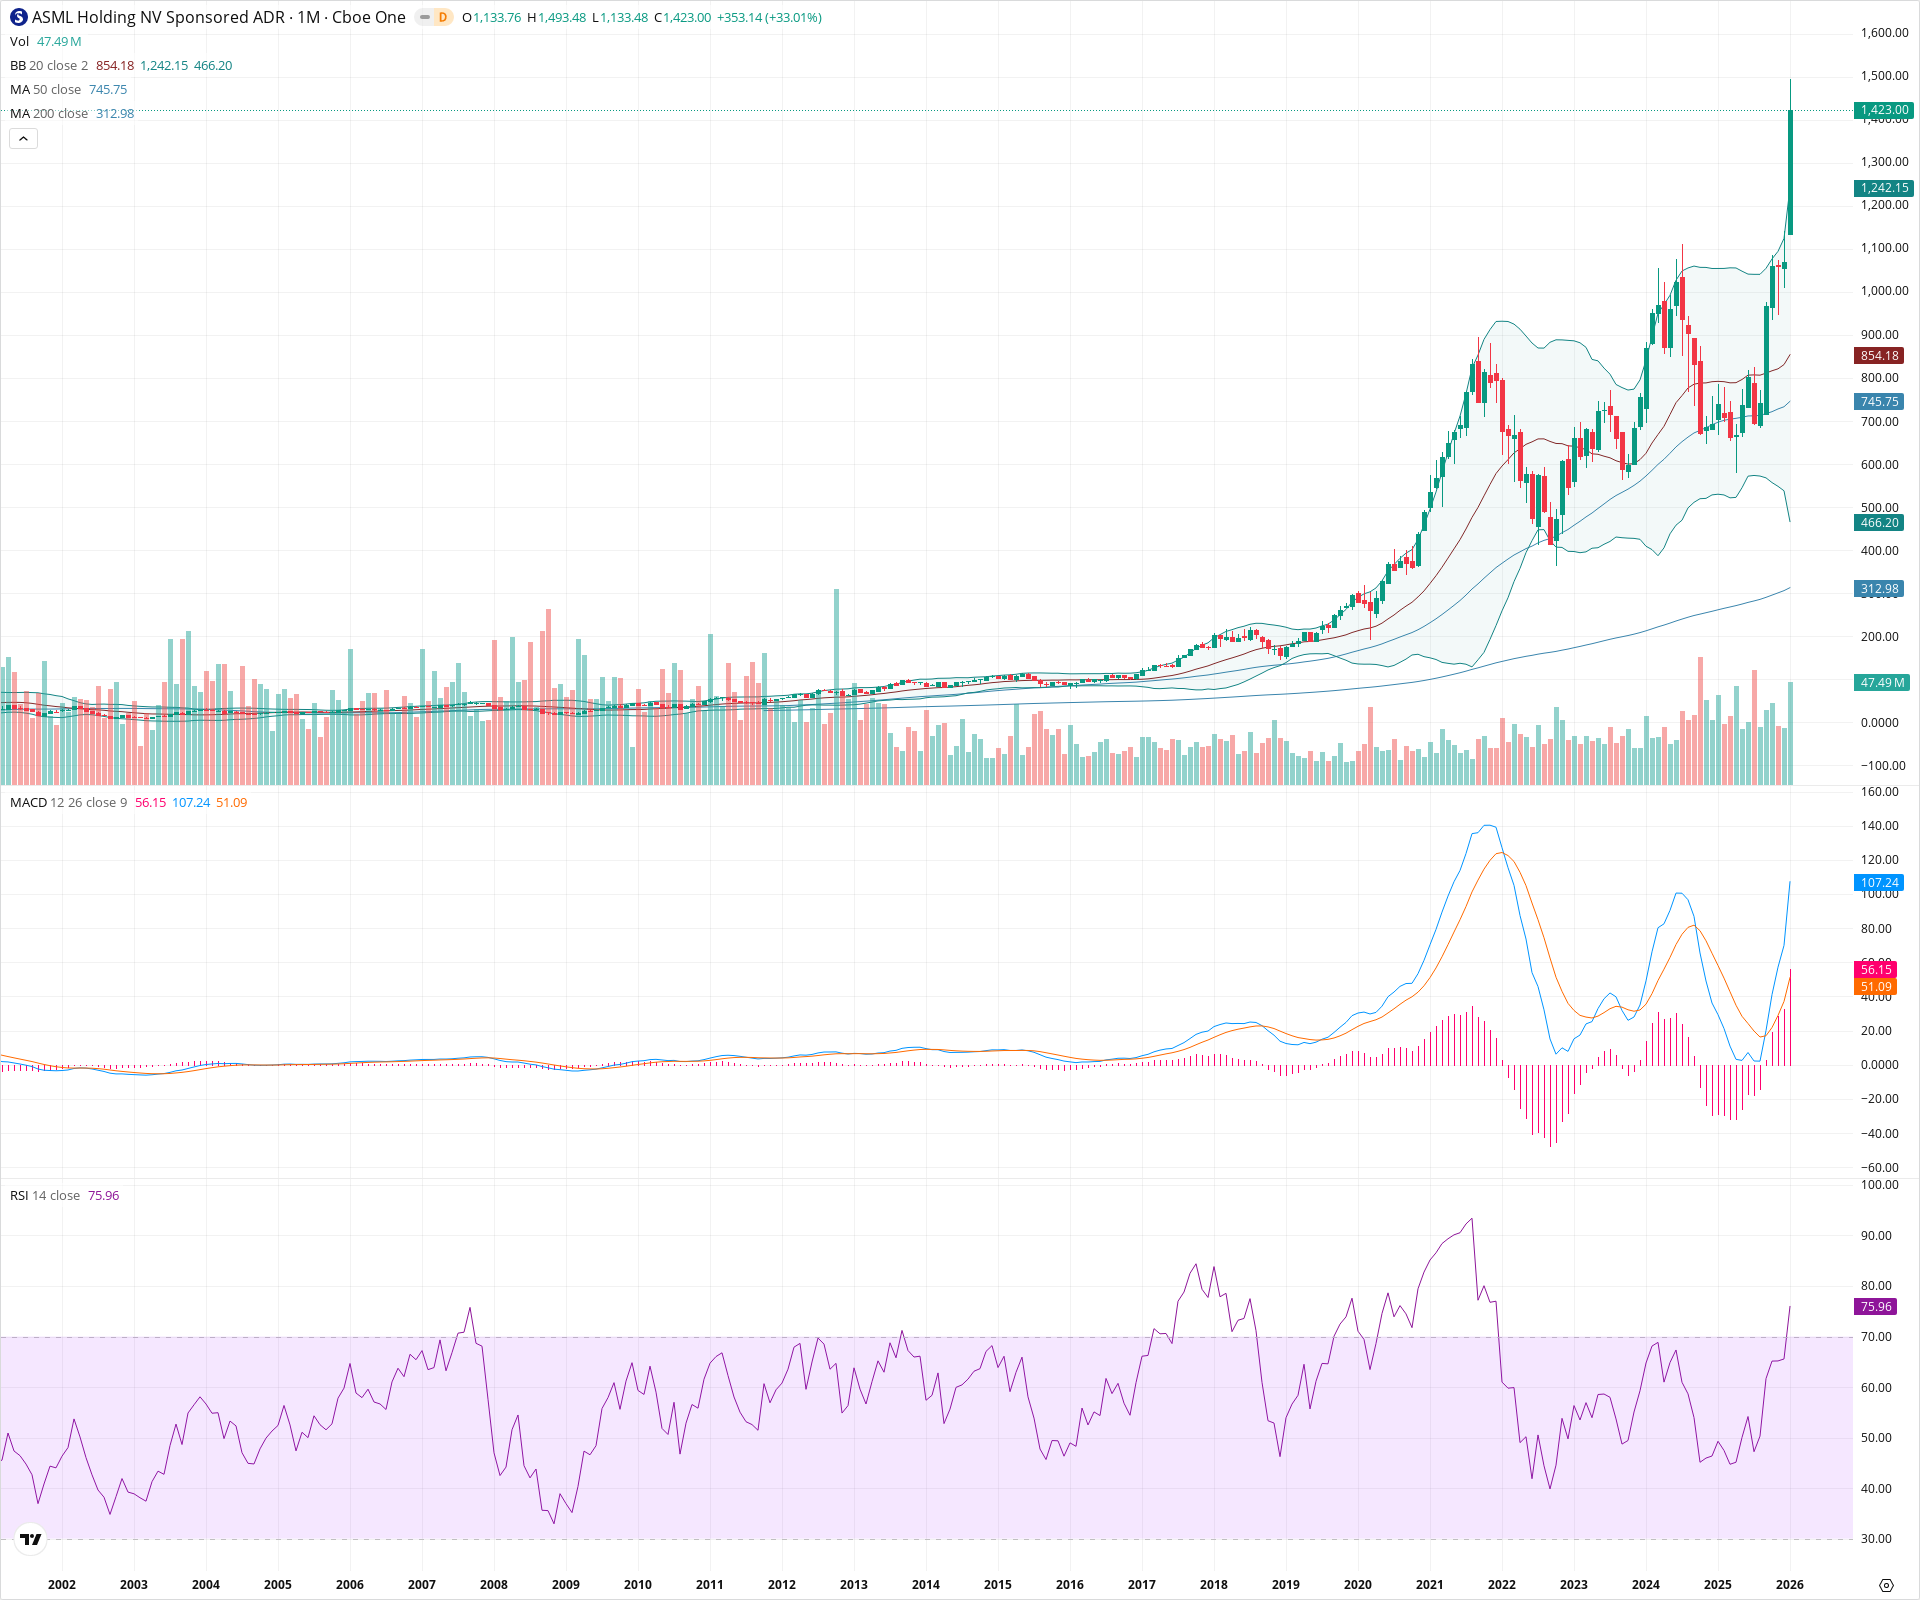
ASML has decisively broken out of a multi-year consolidation pattern to reach new all-time highs, driven by powerful momentum as indicated by the expanding MACD and high RSI. The price is currently riding well above the upper Bollinger Band, reflecting a high-volatility bullish expansion phase. While the vertical move suggests strong conviction, the extension suggests potential for future volatility, though the long-term structural trend remains firmly positive.
Included In Lists
Related Tickers of Interest
ASML Monthly Chart
Sentiment
Short-term Sentiment (days to weeks): Bullish
Price has printed a massive bullish candle (+33%) breaking out to all-time highs. RSI is above 70 (75.96) and price is extending well beyond the upper Bollinger Band, indicating extreme momentum.
Long-term Sentiment (weeks to months): Bullish
The chart shows a confirmed resumption of a secular uptrend. The 20, 50, and 200 SMAs are in perfect bullish alignment and rising. MACD has crossed bullishly and is expanding above the zero line.
Report Metadata
- Timeframe: monthly
- Generated at: 2026-02-02T05:11:35.910Z
- Model: gemini-3-pro-preview
Support Price Levels
| Level | Range | Strength | Notes |
|---|---|---|---|
| $1,075.00 | $1,050.00 - $1,100.00 | Strong | Recent breakout zone from the 2023-2024 consolidation phase. |
| $890.00 | $880.00 - $900.00 | Strong | Former major all-time high from 2021 acting as significant structural support. |
| $745.00 | $740.00 - $750.00 | Strong | Confluence of the 50-month SMA and historical support levels. |
Resistance Price Levels
| Level | Range | Strength | Notes |
|---|---|---|---|
| $1,493.48 | $1,493.48 - $1,493.48 | Weak | Current monthly high and all-time high; represents the only overhead price resistance. |
Potential Chart Patterns in Formation
| Strength | Pattern | Signal | Target | Details |
|---|---|---|---|---|
| Strong | Cup and Handle Breakout | Bullish | N/A | A multi-year saucer/cup formation starting from the 2021 peak, with a consolidation 'handle' in 2023-2024, followed by a decisive breakout to new highs. |
Frequently Asked Questions about ASML
What is the current sentiment for ASML?
The short-term sentiment for ASML is currently Bullish because Price has printed a massive bullish candle (+33%) breaking out to all-time highs. RSI is above 70 (75.96) and price is extending well beyond the upper Bollinger Band, indicating extreme momentum.. The long-term trend is classified as Bullish.
What are the key support levels for ASML?
StockDips.AI has identified key support levels for ASML at $1,075.00 and $890.00. These levels may represent potential accumulation zones where buying interest could emerge.
Is ASML in a significant dip or a Value Dip right now?
ASML has a Value Score of 67/100. It is not currently flagged as a significant dip in the Top Dips list. It is not listed as a Value Dip because the long-term sentiment or value-score threshold does not qualify.
View the full interactive analysis on StockDips.AI.