ASTS Monthly Technical Analysis
AST SpaceMobile, Inc
Aerospace and satellite communications company that is building the first and only space-based cellular broadband network designed to connect directly with standard, unmodified mobile phones. The company's mission is to eliminate connectivity gaps globally by providing 4G and 5G coverage in remote and underserved regions where traditional ground infrastructure is unavailable.
ASTS Technical Analysis Summary
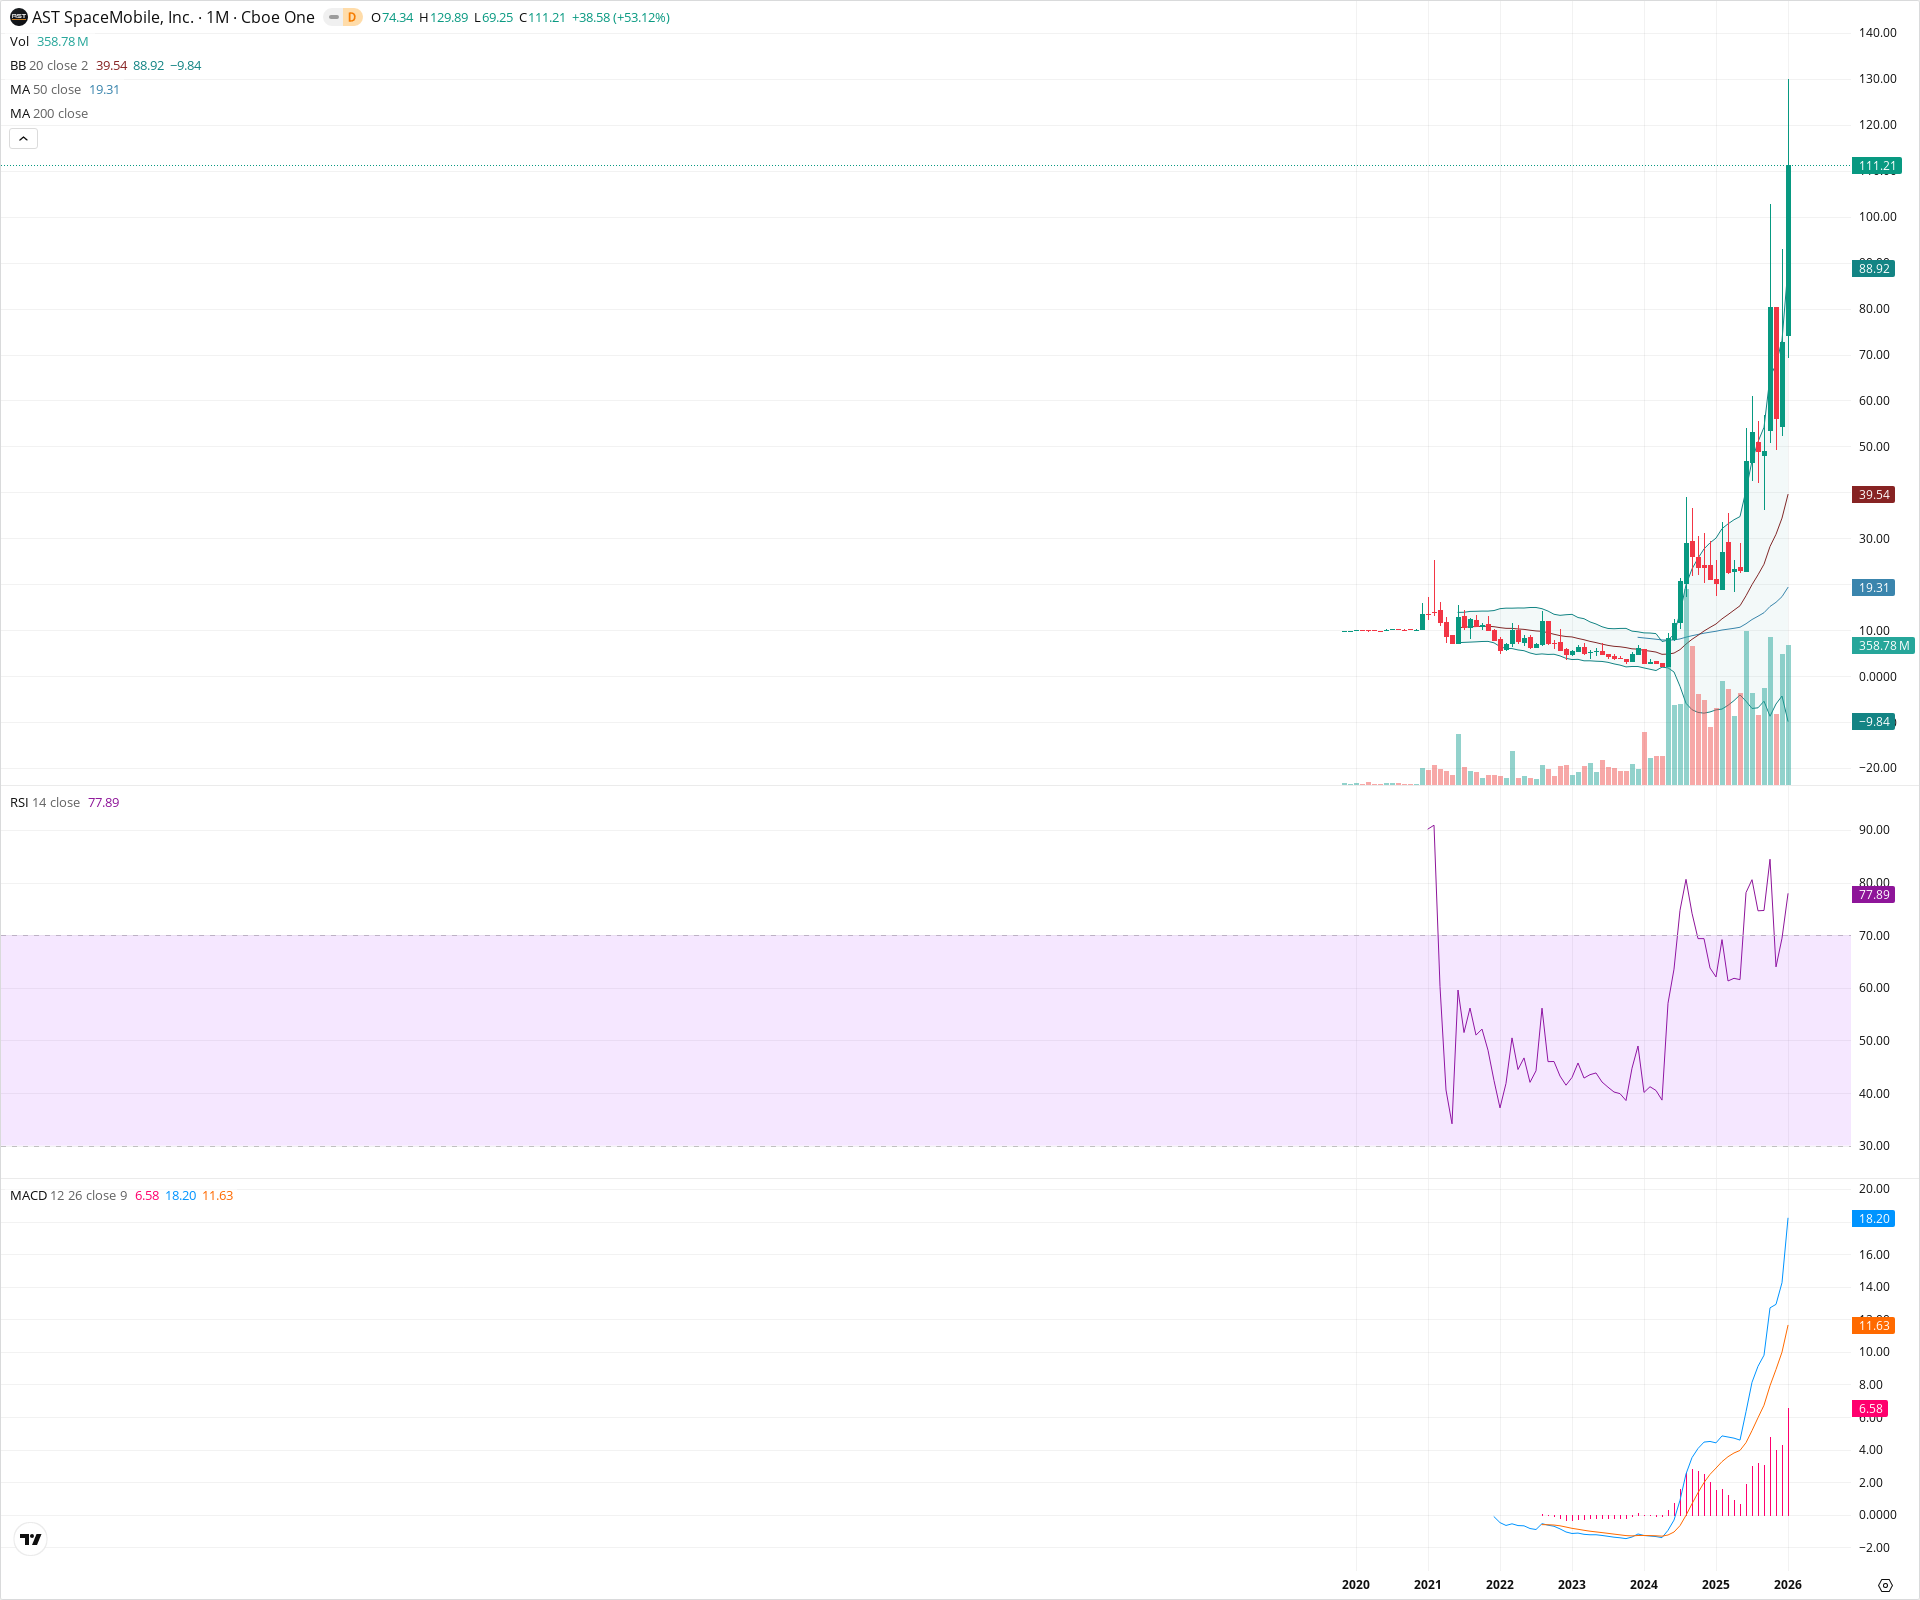
ASTS has transitioned from a long-term accumulation base into a powerful parabolic uptrend, shattering previous all-time highs with significant volume expansion. While the momentum is undeniably bullish with the price riding well above the upper Bollinger Band, the vertical trajectory suggests high volatility ahead for long-term investors.
Included In Lists
Related Tickers of Interest
ASTS Monthly Chart
Sentiment
Short-term Sentiment (days to weeks): Bullish
The price is in a vertical parabolic discovery phase, trading at all-time highs with expanding volume and RSI well above 70, indicating intense momentum.
Long-term Sentiment (weeks to months): Bullish
The stock has decisively broken out of a multi-year base structure. Long-term moving averages are beginning to trend upward, and the MACD is strongly divergent from the zero line.
Report Metadata
- Timeframe: monthly
- Generated at: 2026-02-02T05:11:32.711Z
- Model: gemini-3-pro-preview
Support Price Levels
| Level | Range | Strength | Notes |
|---|---|---|---|
| $69.63 | $69.25 - $70.00 | Weak | Current month's low; immediate pullback support in a volatile trend. |
| $39.50 | $39.00 - $40.00 | Strong | Confluence of the 20-month SMA and the price shelf prior to the latest parabolic extension. |
| $13.50 | $12.00 - $15.00 | Strong | Original breakout zone from the multi-year base structure. |
Resistance Price Levels
| Level | Range | Strength | Notes |
|---|---|---|---|
| $129.95 | $129.89 - $130.00 | Weak | Current monthly high and immediate price ceiling. |
| $145.00 | $140.00 - $150.00 | Weak | Psychological resistance levels in blue-sky territory. |
Potential Chart Patterns in Formation
| Strength | Pattern | Signal | Target | Details |
|---|---|---|---|---|
| Strong | Rounding Bottom Breakout | Bullish | N/A | A multi-year base formed from 2021 to 2024 which resolved in a massive breakout above the $14-15 range. |
| Strong | Parabolic Advance | Bullish | N/A | Price is moving vertically with separation from moving averages, typical of extreme momentum phases. |
Frequently Asked Questions about ASTS
What is the current sentiment for ASTS?
The short-term sentiment for ASTS is currently Bullish because The price is in a vertical parabolic discovery phase, trading at all-time highs with expanding volume and RSI well above 70, indicating intense momentum.. The long-term trend is classified as Bullish.
What are the key support levels for ASTS?
StockDips.AI has identified key support levels for ASTS at $69.63 and $39.50. These levels may represent potential accumulation zones where buying interest could emerge.
Is ASTS in a significant dip or a Value Dip right now?
ASTS has a Value Score of 95/100. It is currently flagged as a significant dip in the Top Dips list. It is also listed as a Value Dip because long-term sentiment is bullish.
View the full interactive analysis on StockDips.AI.