CELH Weekly Technical Analysis
Celsius Holdings Inc
Produces fitness-oriented energy drinks marketed as a healthier alternative.
CELH Technical Analysis Summary
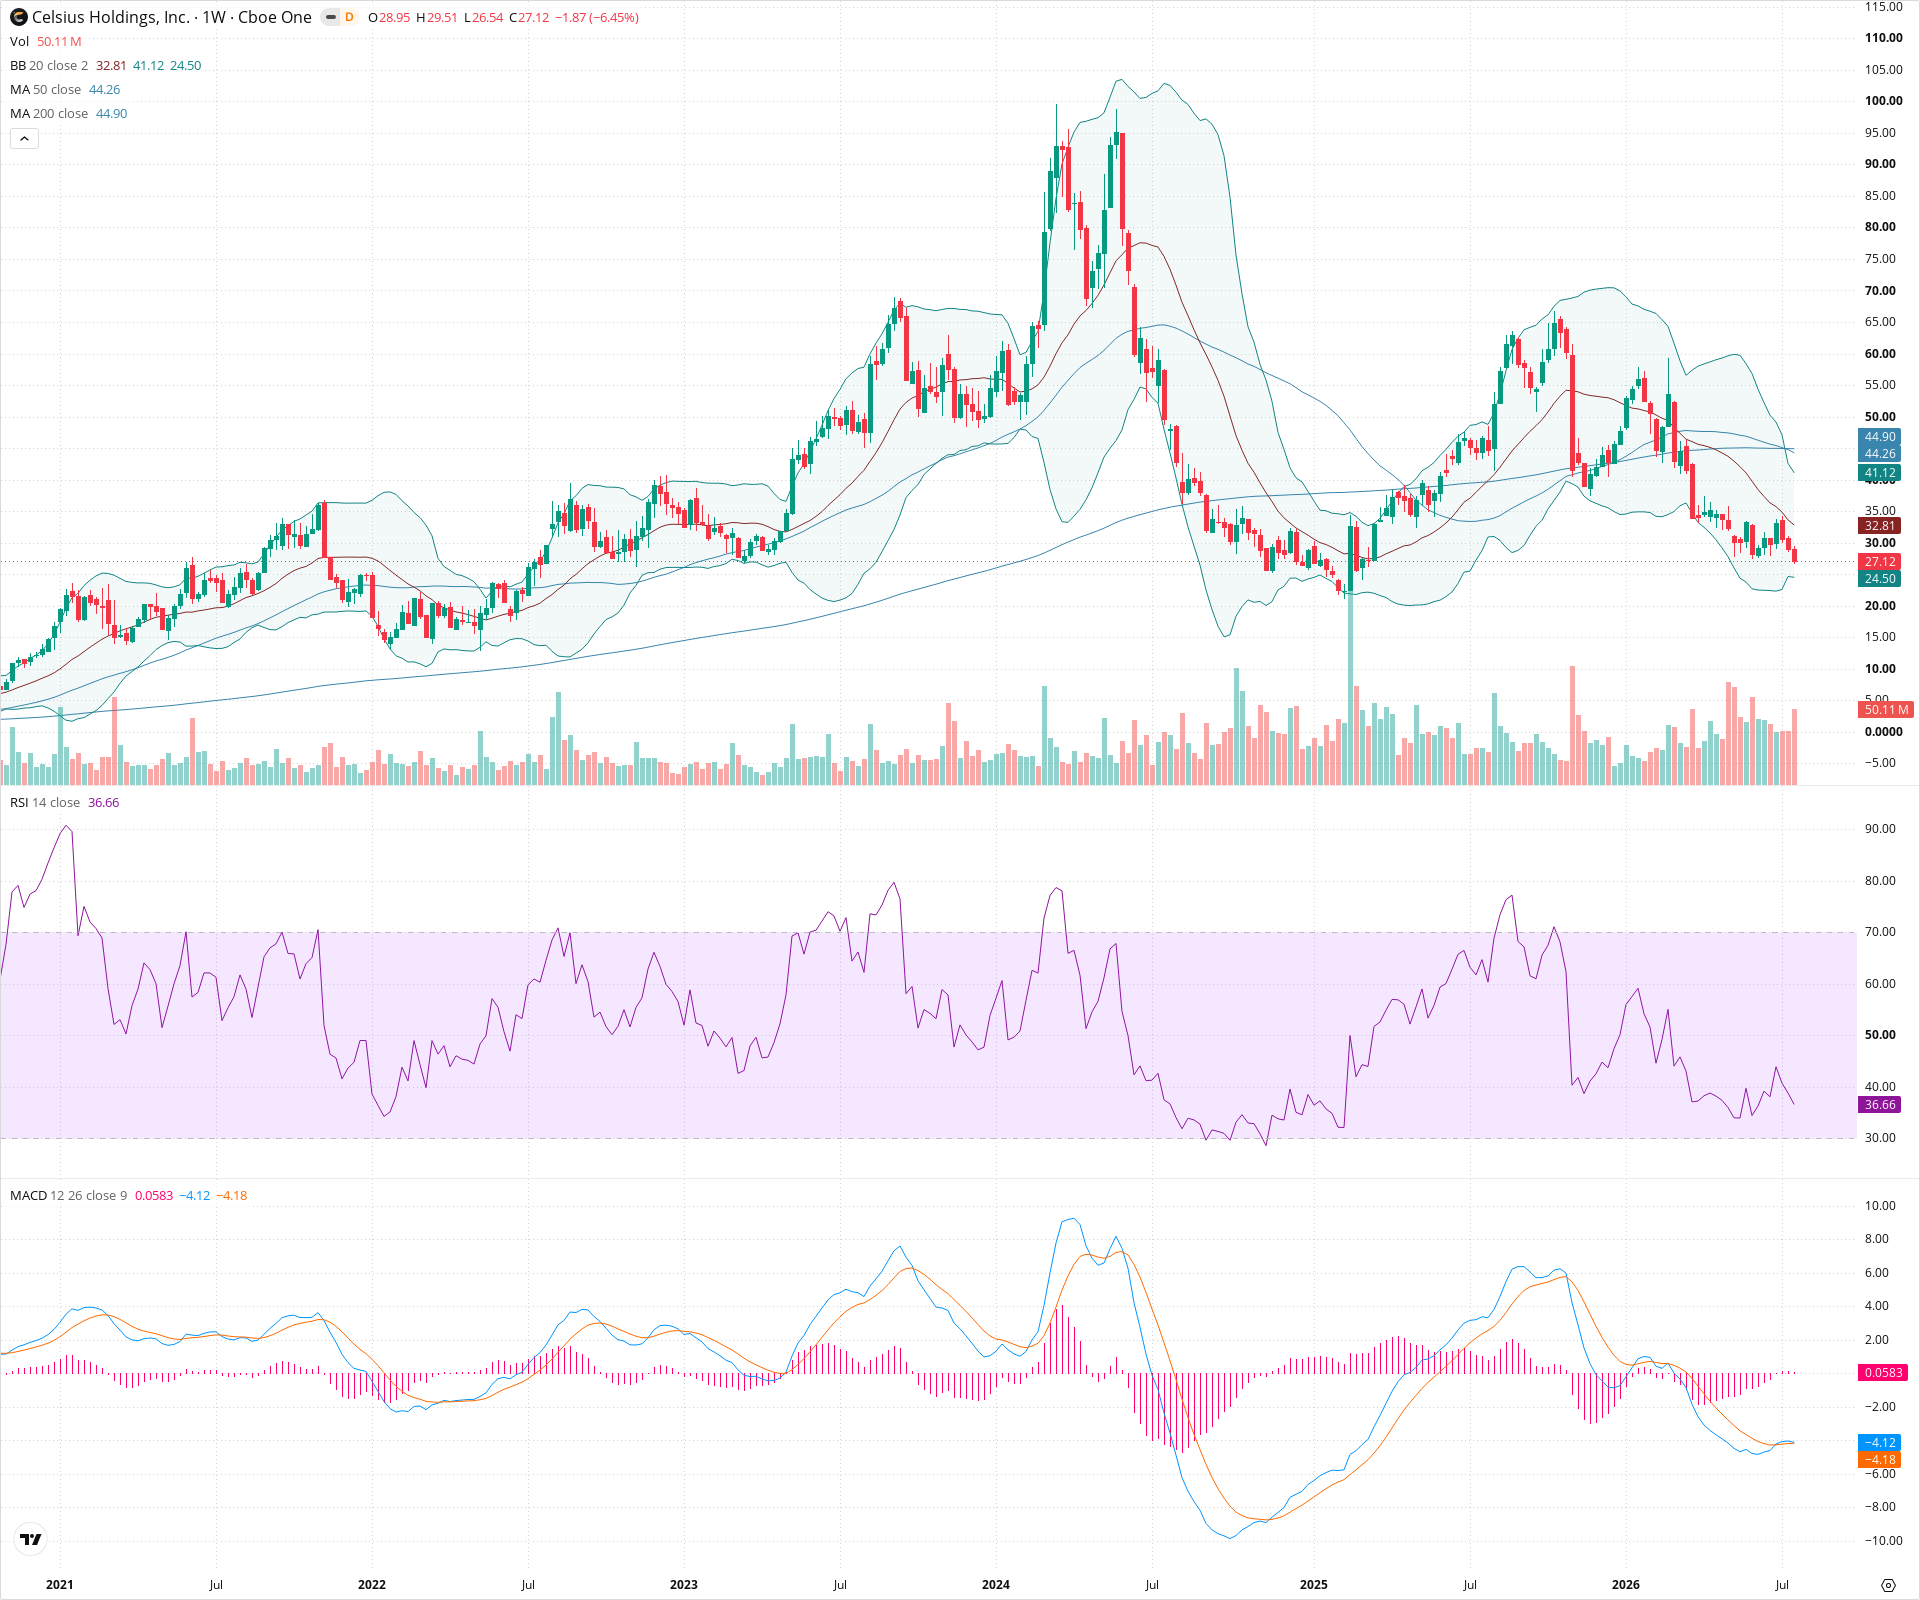
CELH has experienced a severe structural breakdown on the weekly timeframe, transitioning from a massive historical run-up into a confirmed long-term downtrend. The technical picture is dominated by a recent Death Cross between the 50-week and 200-week SMAs, alongside deeply negative momentum indicators. Long-term investors must contend with heavy overhead resistance, suggesting that the stock requires significant time to repair the technical damage before any sustainable recovery can begin.
Included In Lists
Related Tickers of Interest
CELH Weekly Chart
Sentiment
Short-term Sentiment (days to weeks): Bearish
Price is firmly constrained below the declining 20-week SMA, RSI is weak in the mid-30s, and MACD lines remain deep in negative territory.
Long-term Sentiment (weeks to months): Bearish
A major structural breakdown is evident as the 50-week SMA has recently crossed below the 200-week SMA (Death Cross), confirming a long-term trend reversal.
Report Metadata
- Timeframe: weekly
- Generated at: 2026-07-25T09:07:58.301Z
- Model: gemini-3.1-pro-preview
Support Price Levels
| Level | Range | Strength | Notes |
|---|---|---|---|
| $25.50 | $24.50 - $26.50 | Weak | Recent swing low and proximity to the lower Bollinger Band. |
| $17.50 | $15.00 - $20.00 | Strong | Major historical consolidation base and prior resistance-turned-support before the large 2023 run-up. |
Resistance Price Levels
| Level | Range | Strength | Notes |
|---|---|---|---|
| $33.50 | $32.00 - $35.00 | Strong | Immediate overhead resistance zone defined by the 20-week SMA and previous minor support. |
| $45.00 | $44.00 - $46.00 | Strong | Heavy confluence of the 50-week and 200-week SMAs at the site of the recent Death Cross. |
Potential Chart Patterns in Formation
| Strength | Pattern | Signal | Target | Details |
|---|---|---|---|---|
| Strong | Death Cross | Bearish | N/A | The 50-week simple moving average has crossed below the 200-week simple moving average, signaling a significant long-term shift in momentum to the downside. |
| Strong | Markdown Phase / Downtrend | Bearish | N/A | A sustained series of lower highs and lower lows following a massive peak, characterized by price remaining below all key moving averages. |
Frequently Asked Questions about CELH
What is the current sentiment for CELH?
The short-term sentiment for CELH is currently Bearish because Price is firmly constrained below the declining 20-week SMA, RSI is weak in the mid-30s, and MACD lines remain deep in negative territory.. The long-term trend is classified as Bearish.
What are the key support levels for CELH?
StockDips.AI has identified key support levels for CELH at $25.50 and $17.50. These levels may represent potential accumulation zones where buying interest could emerge.
Is CELH in a significant dip or a Value Dip right now?
CELH has a Value Score of 85/100. It is currently flagged as a significant dip in the Top Dips list. It is not listed as a Value Dip because the long-term sentiment or value-score threshold does not qualify.
View the full interactive analysis on StockDips.AI.