CELH Monthly Technical Analysis
Celsius Holdings Inc
Produces fitness-oriented energy drinks marketed as a healthier alternative.
CELH Technical Analysis Summary
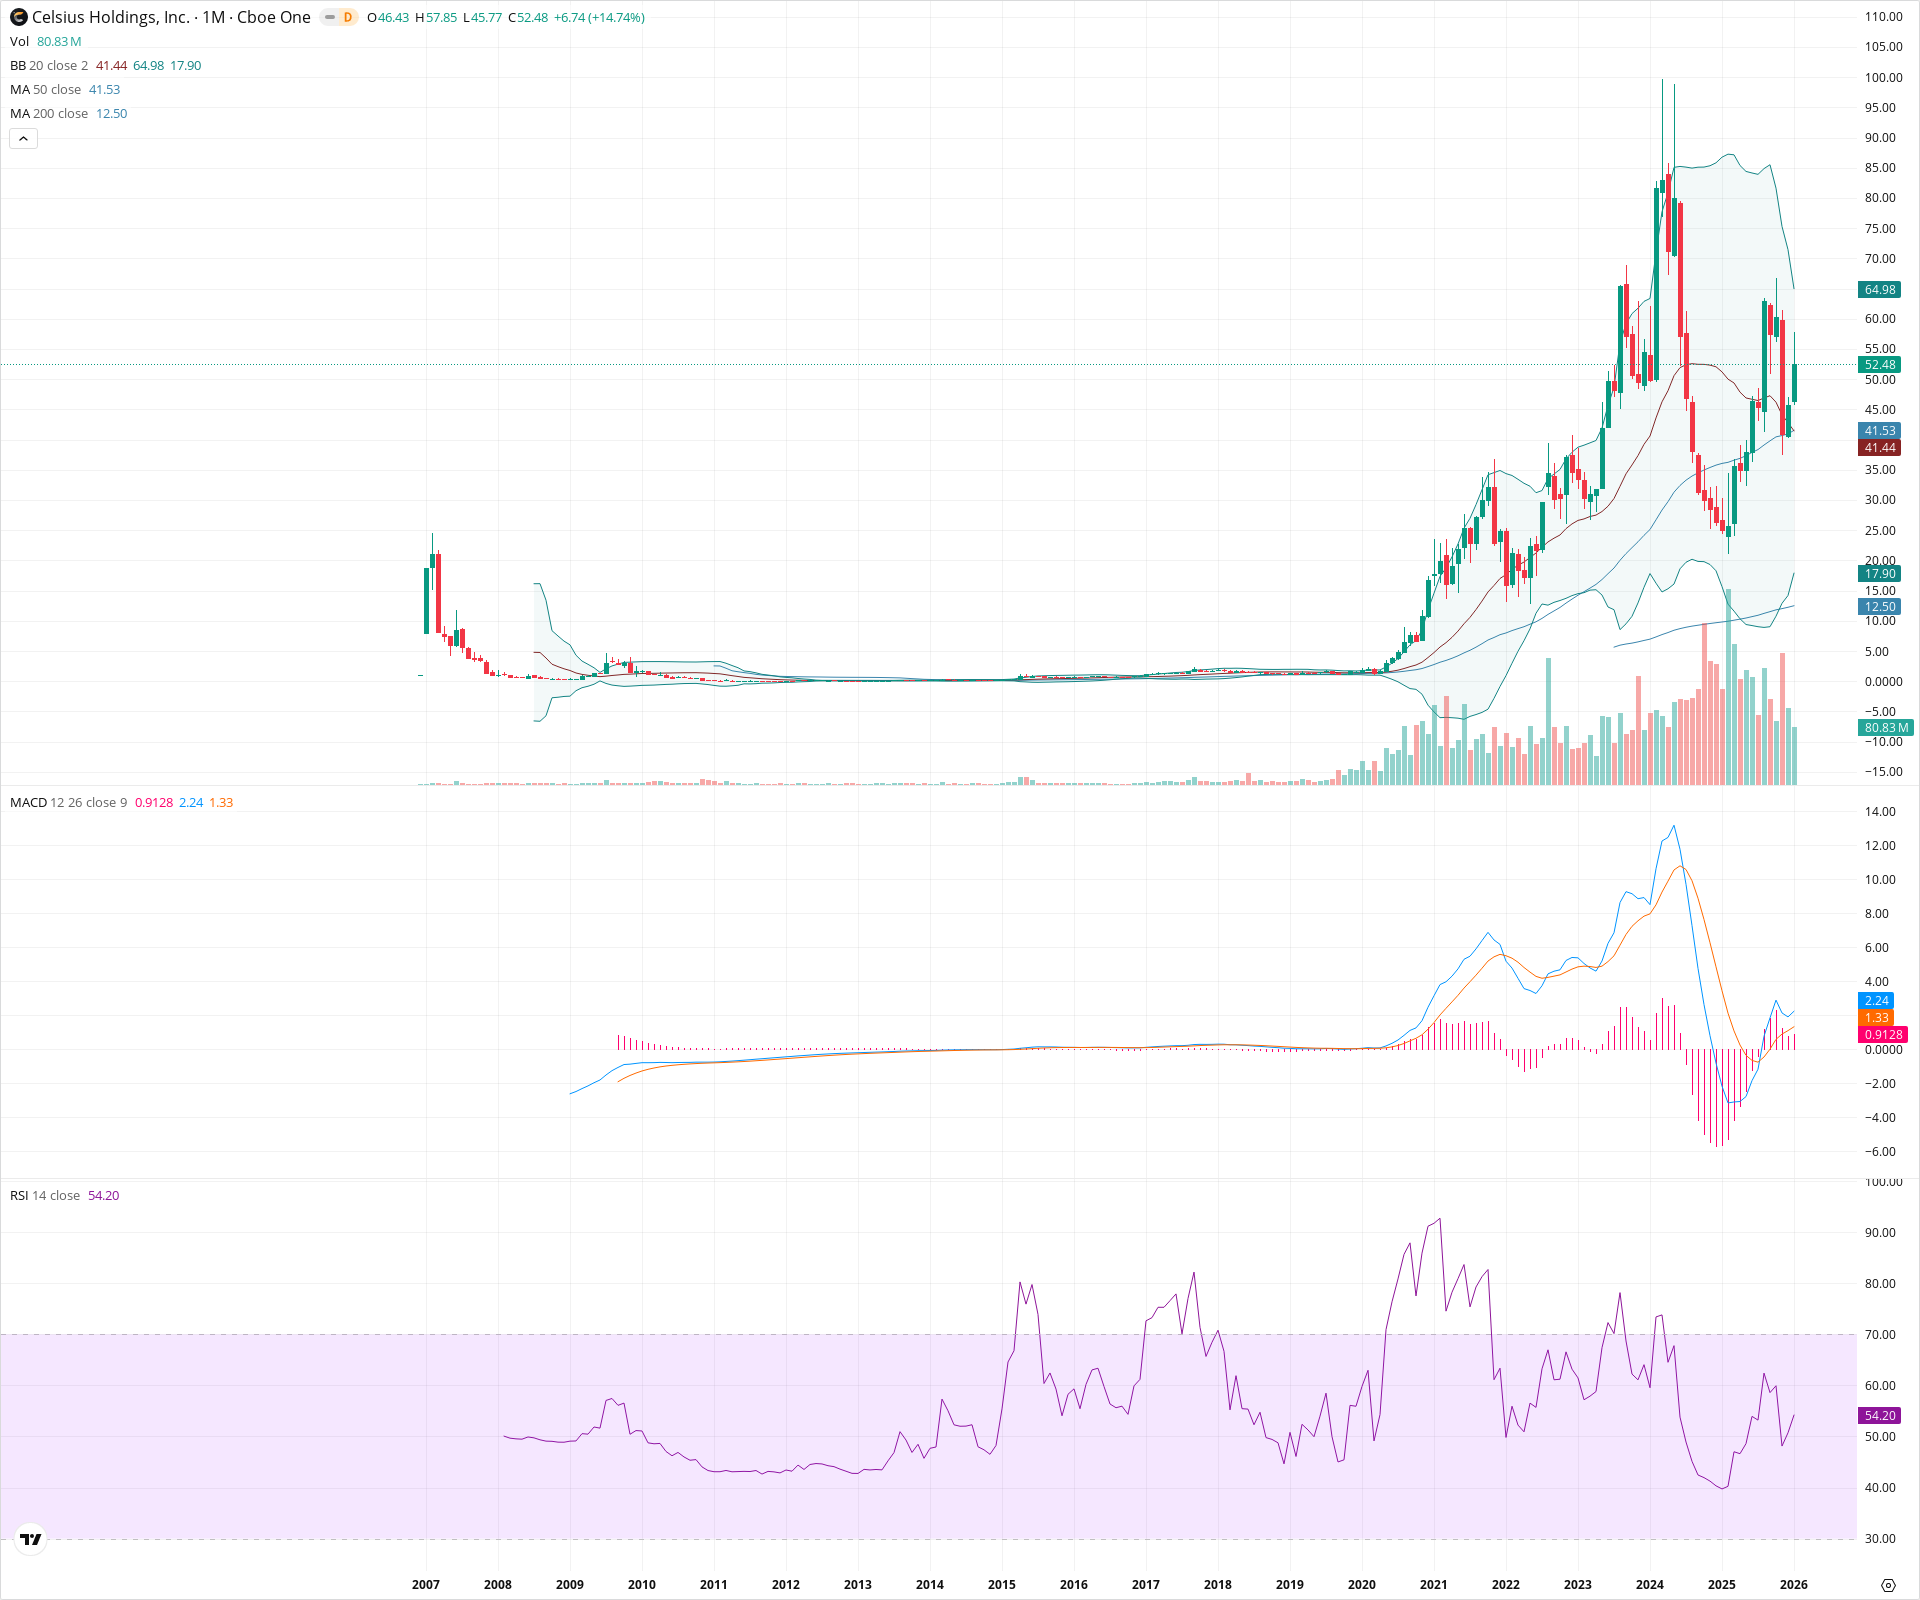
Celsius Holdings is undergoing a strong structural recovery on the monthly timeframe, having successfully reclaimed the 20 and 50-month moving average cluster around 41.50. The bullish MACD crossover and rising RSI indicate that momentum has shifted back in favor of buyers after a deep drawdown. While volatility is high, the preservation of the long-term uptrend suggests potential for a test of the upper Bollinger Band near 65.00.
Included In Lists
Related Tickers of Interest
CELH Monthly Chart
Sentiment
Short-term Sentiment (days to weeks): Bullish
Price has aggressively rebounded, reclaiming the 20 and 50-month SMAs. A fresh bullish crossover on the monthly MACD confirms renewed positive momentum.
Long-term Sentiment (weeks to months): Bullish
Despite a significant correction from all-time highs, the secular trend remains intact with price holding above the rising 200-month SMA and recently reclaiming the 50-month SMA.
Report Metadata
- Timeframe: monthly
- Generated at: 2026-02-02T05:32:35.368Z
- Model: gemini-3-pro-preview
Support Price Levels
| Level | Range | Strength | Notes |
|---|---|---|---|
| $41.50 | $41.40 - $41.60 | Strong | Confluence of the 20-month and 50-month SMAs which price has recently reclaimed. |
| $30.00 | $28.00 - $32.00 | Strong | Major swing low established during the recent correction; marks the bottom of the pullback. |
Resistance Price Levels
| Level | Range | Strength | Notes |
|---|---|---|---|
| $64.50 | $64.00 - $65.00 | Weak | Upper Bollinger Band and prior structural congestion area. |
| $97.00 | $95.00 - $99.00 | Strong | All-time high zone formed in early-to-mid 2024. |
Potential Chart Patterns in Formation
| Strength | Pattern | Signal | Target | Details |
|---|---|---|---|---|
| Strong | V-Bottom Recovery | Bullish | $65.00 | Sharp rebound following a deep multi-month correction, characterized by strong buying pressure lifting price back above key moving averages. |
Frequently Asked Questions about CELH
What is the current sentiment for CELH?
The short-term sentiment for CELH is currently Bullish because Price has aggressively rebounded, reclaiming the 20 and 50-month SMAs. A fresh bullish crossover on the monthly MACD confirms renewed positive momentum.. The long-term trend is classified as Bullish.
What are the key support levels for CELH?
StockDips.AI has identified key support levels for CELH at $41.50 and $30.00. These levels may represent potential accumulation zones where buying interest could emerge.
Is CELH in a significant dip or a Value Dip right now?
CELH has a Value Score of 85/100. It is currently flagged as a significant dip in the Top Dips list. It is also listed as a Value Dip because long-term sentiment is bullish.
View the full interactive analysis on StockDips.AI.