CELH Daily Technical Analysis
Celsius Holdings Inc
Produces fitness-oriented energy drinks marketed as a healthier alternative.
CELH Technical Analysis Summary
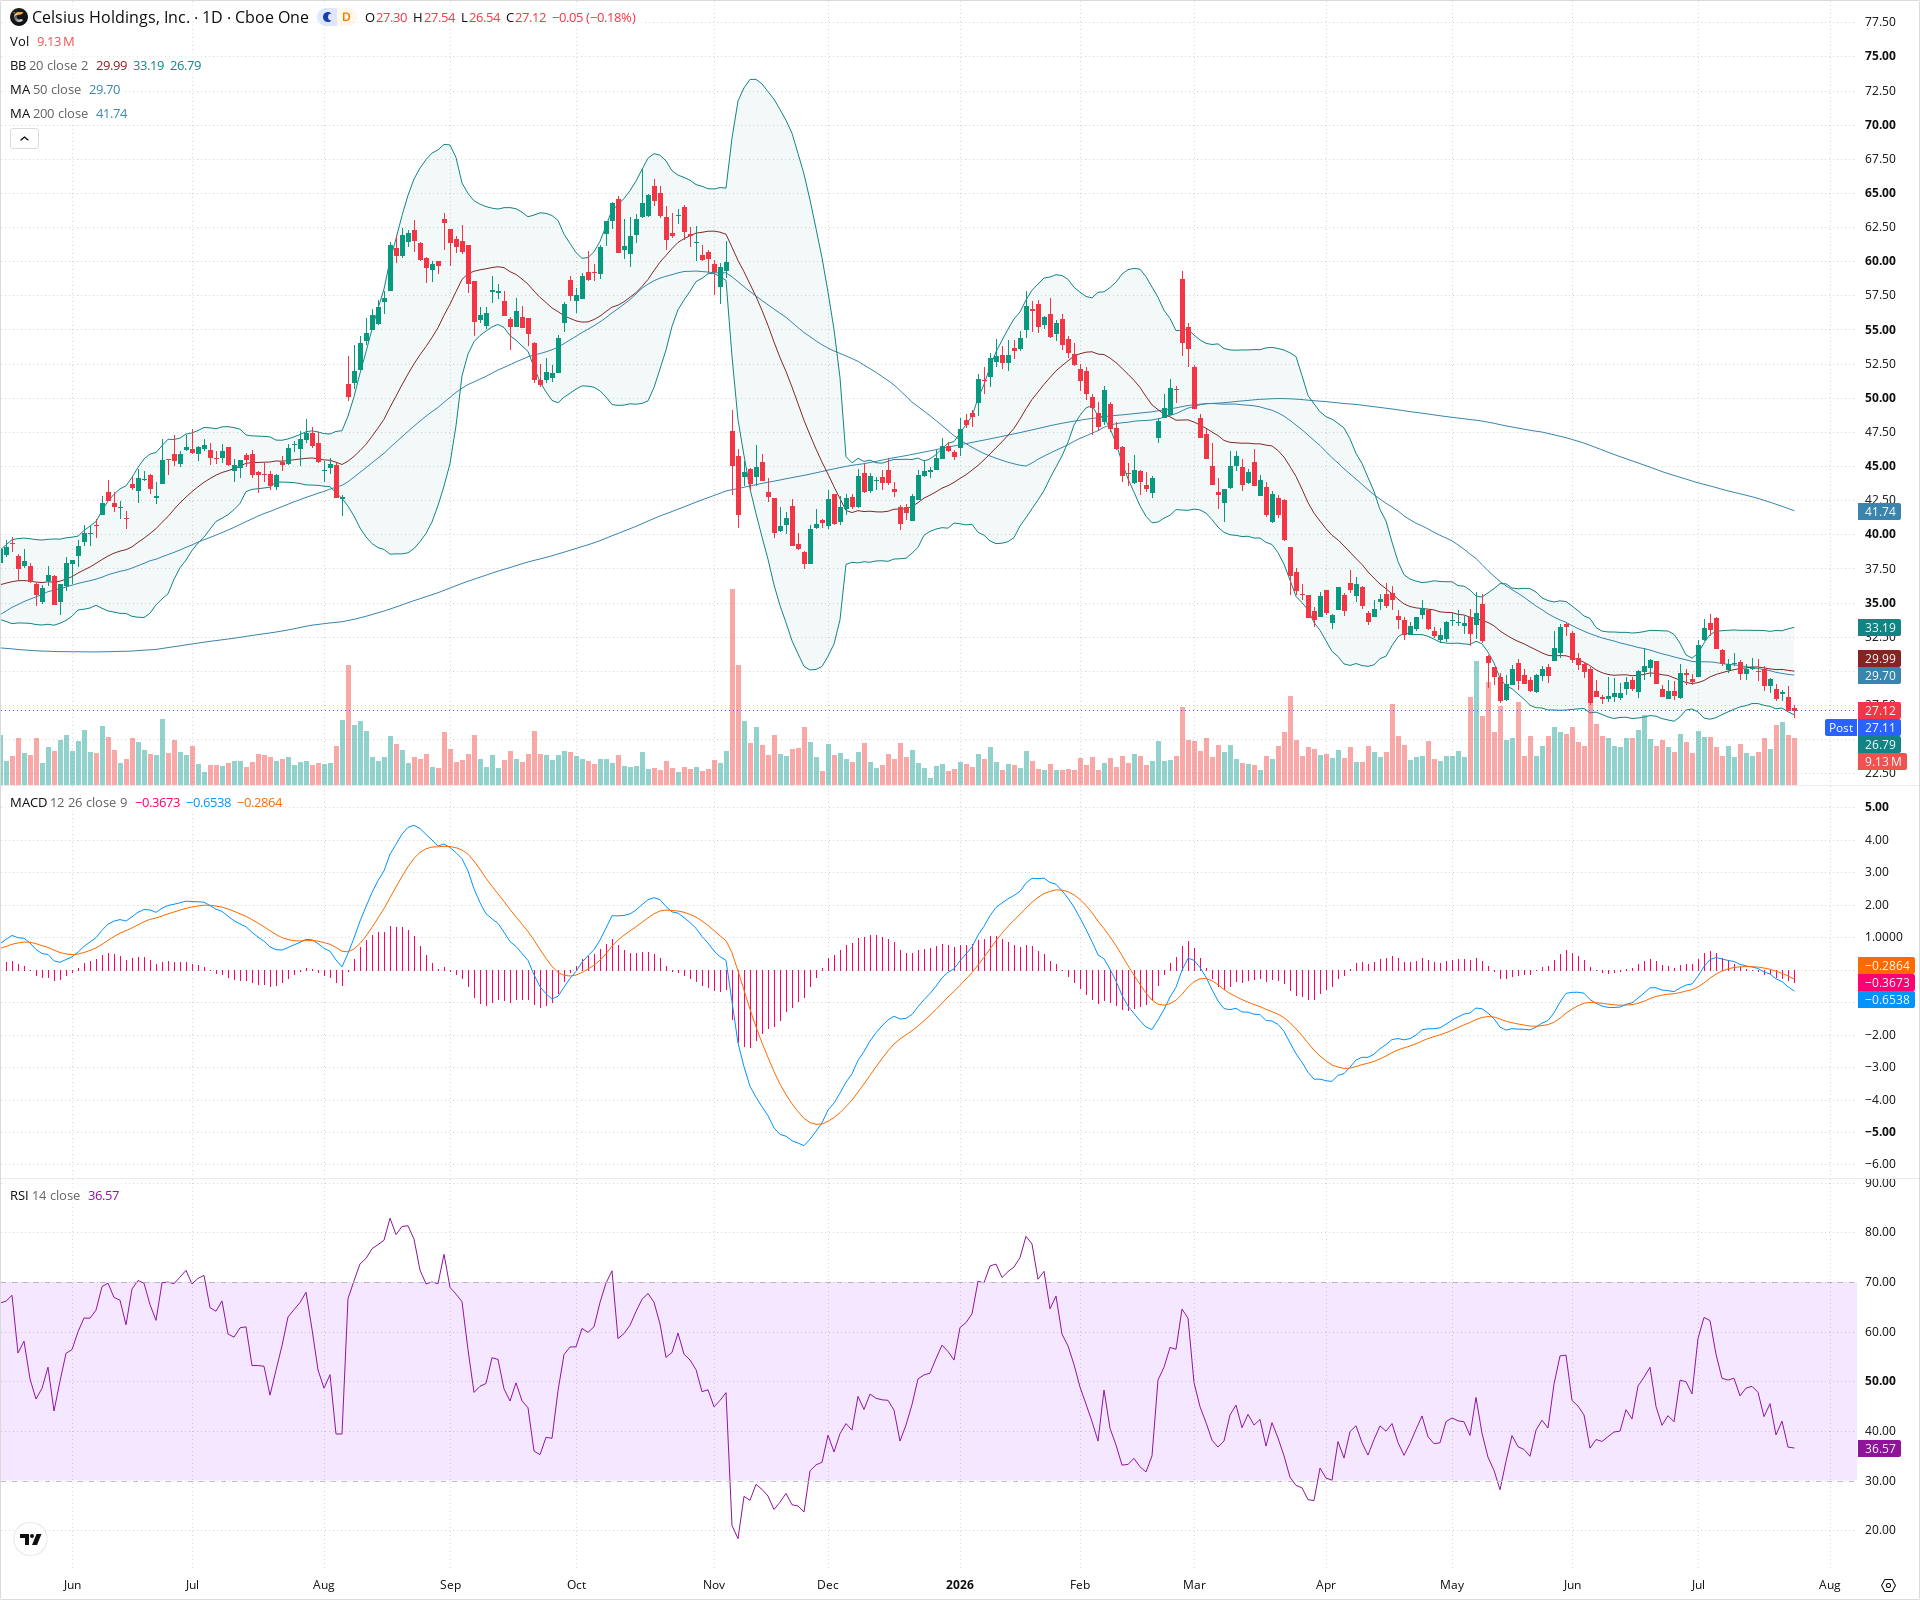
CELH is entrenched in a severe, long-term downtrend with no immediate technical signs of a structural reversal. Recent price action highlights a breakdown from a brief consolidation phase, reinforced by bearish momentum indicators like the MACD crossover. For long-term investors, the technical posture remains firmly defensive until the stock can at least reclaim and hold above its 50-day moving average and break the pattern of lower highs.
Included In Lists
Related Tickers of Interest
CELH Daily Chart
Sentiment
Short-term Sentiment (days to weeks): Bearish
Price has recently broken below a consolidation zone, making a new swing low. The MACD has registered a bearish crossover with expanding negative momentum, and the RSI is declining towards oversold territory while remaining below 50. Price is contained below declining short-term moving averages.
Long-term Sentiment (weeks to months): Bearish
The stock is in a confirmed long-term downtrend, characterized by a clear sequence of lower highs and lower lows. Price is trading significantly below a downward-sloping 200-day SMA, and the 50-day SMA remains well below the 200-day SMA.
Report Metadata
- Timeframe: daily
- Generated at: 2026-07-24T21:07:45.000Z
- Model: gemini-3.1-pro-preview
Support Price Levels
| Level | Range | Strength | Notes |
|---|---|---|---|
| $26.60 | $26.00 - $27.20 | Weak | Current active swing low zone; price is attempting to find footing here, but conviction is currently lacking. |
| $24.25 | $23.50 - $25.00 | Weak | Estimated historical base/consolidation area from the far left of the chart before the major uptrend began. |
Resistance Price Levels
| Level | Range | Strength | Notes |
|---|---|---|---|
| $30.00 | $29.50 - $30.50 | Strong | Recent breakdown level and current location of the declining 20-day and 50-day SMAs. |
| $33.75 | $33.00 - $34.50 | Moderate | Previous lower high swing point established before the most recent leg down. |
| $41.75 | $41.00 - $42.50 | Strong | Zone around the declining 200-day SMA, representing major long-term structural resistance. |
Potential Chart Patterns in Formation
| Strength | Pattern | Signal | Target | Details |
|---|---|---|---|---|
| Strong | Sustained Downtrend | Bearish | N/A | A prolonged pattern of lower highs and lower lows spanning the majority of the visible chart, with price contained below major moving averages. |
| Strong | Bearish Consolidation Breakdown | Bearish | N/A | Price recently consolidated in a tight range near $30 before breaking downward, signaling a continuation of the broader trend. |
Frequently Asked Questions about CELH
What is the current sentiment for CELH?
The short-term sentiment for CELH is currently Bearish because Price has recently broken below a consolidation zone, making a new swing low. The MACD has registered a bearish crossover with expanding negative momentum, and the RSI is declining towards oversold territory while remaining below 50. Price is contained below declining short-term moving averages.. The long-term trend is classified as Bearish.
What are the key support levels for CELH?
StockDips.AI has identified key support levels for CELH at $26.60 and $24.25. These levels may represent potential accumulation zones where buying interest could emerge.
Is CELH in a significant dip or a Value Dip right now?
CELH has a Value Score of 84/100. It is currently flagged as a significant dip in the Top Dips list. It is not listed as a Value Dip because the long-term sentiment or value-score threshold does not qualify.
View the full interactive analysis on StockDips.AI.