COIN Monthly Technical Analysis
Coinbase Global Inc
Cryptocurrency exchange offering trading, custody, and blockchain services.
COIN Technical Analysis Summary
COIN is undergoing a significant monthly correction, having lost the support of its 20-month SMA and triggered a bearish MACD crossover. The price is currently approaching a critical test of the 50-month SMA near 170, which serves as the primary line of defense for the longer-term uptrend structure. Momentum has shifted downward with RSI falling below 50, indicating that the stock is likely entering a period of consolidation or further downside testing before a new trend can emerge.
Included In Lists
Related Tickers of Interest
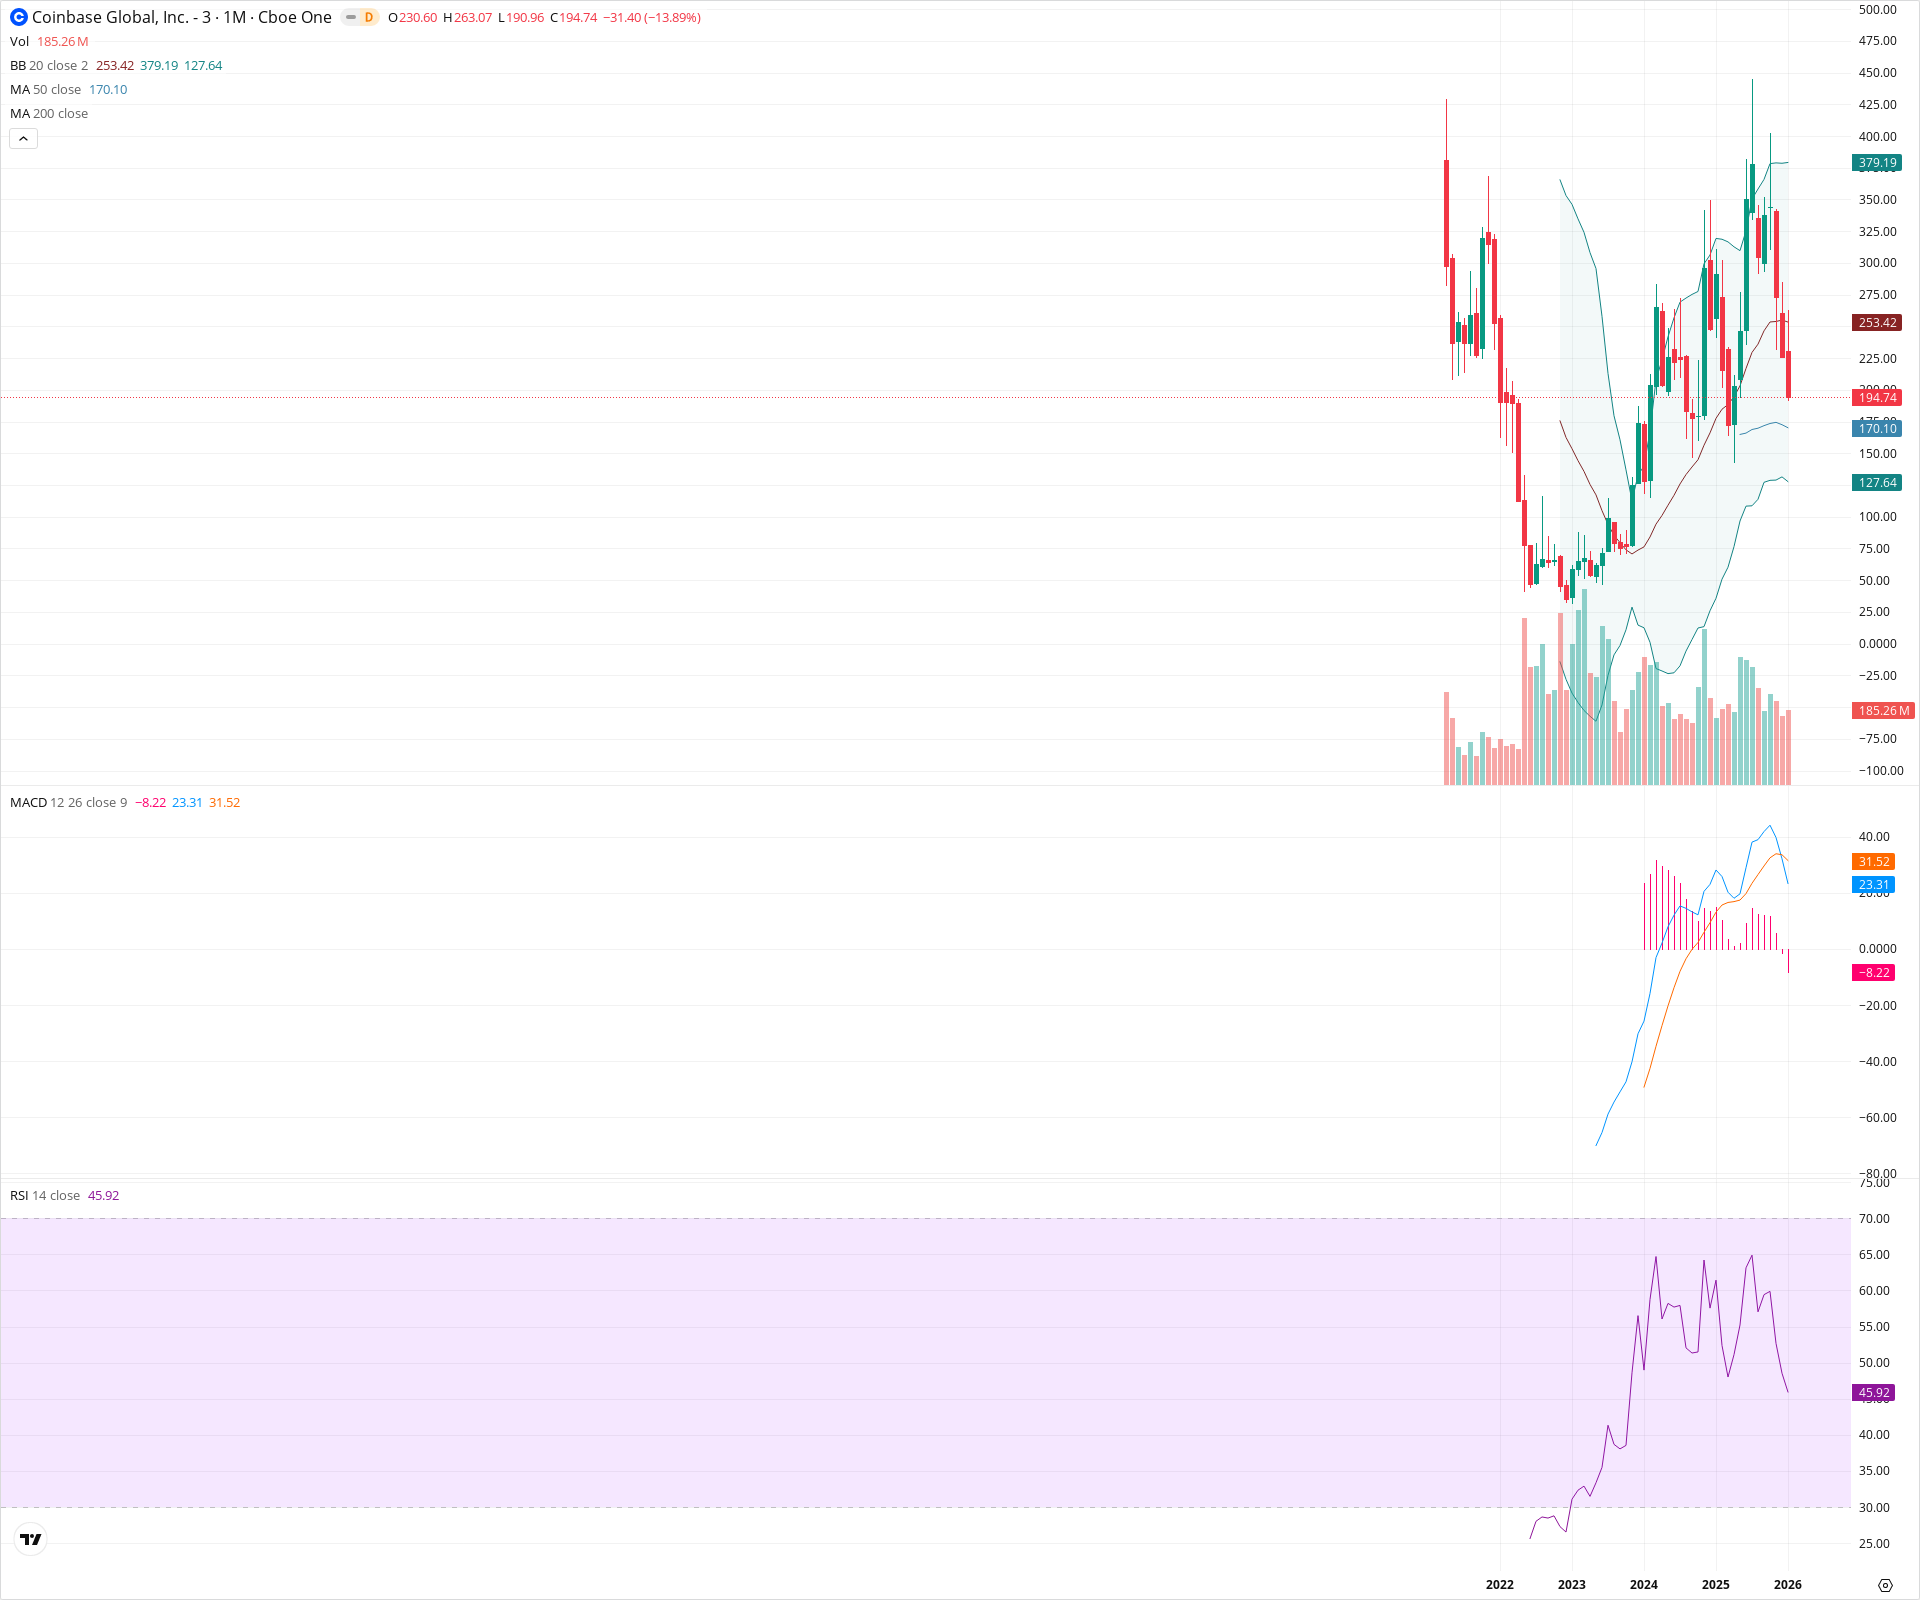
COIN Monthly Chart
Sentiment
Short-term Sentiment (days to weeks): Bearish
Price has broken significantly below the 20-month SMA (253.42) with a strong red candle (-13.89%). A bearish MACD crossover has occurred, and RSI has dropped below the neutral 50 level.
Long-term Sentiment (weeks to months): Neutral
While the stock remains above the rising 50-month SMA (170.10), the failure to sustain recent highs and the confirmed monthly MACD sell signal suggest a transition from a bull trend to a multi-month consolidation or correction regime.
Report Metadata
- Timeframe: monthly
- Generated at: 2026-02-02T05:30:20.293Z
- Model: gemini-3-pro-preview
Support Price Levels
| Level | Range | Strength | Notes |
|---|---|---|---|
| $170.10 | $170.10 - $170.10 | Strong | 50-period SMA acting as major dynamic support. |
| $122.50 | $115.00 - $130.00 | Strong | Structural support zone from the 2023 breakout base and lower Bollinger Band proximity. |
Resistance Price Levels
| Level | Range | Strength | Notes |
|---|---|---|---|
| $253.42 | $253.42 - $253.42 | Strong | 20-period SMA (Bollinger Band basis) which price has recently lost. |
| $285.00 | $280.00 - $290.00 | Weak | Recent swing highs formed prior to the current correction. |
Potential Chart Patterns in Formation
| Strength | Pattern | Signal | Target | Details |
|---|---|---|---|---|
| Strong | Rounding Bottom | Bullish | N/A | A prolonged multi-year accumulation base formed between 2022 and 2023, leading to the 2024 rally. |
| Strong | Deep Correction | Bearish | $170.10 | Current price action represents a sharp pullback from recent highs, testing the validity of the previous breakout trend. |
Frequently Asked Questions about COIN
What is the current sentiment for COIN?
The short-term sentiment for COIN is currently Bearish because Price has broken significantly below the 20-month SMA (253.42) with a strong red candle (-13.89%). A bearish MACD crossover has occurred, and RSI has dropped below the neutral 50 level.. The long-term trend is classified as Neutral.
What are the key support levels for COIN?
StockDips.AI has identified key support levels for COIN at $170.10 and $122.50. These levels may represent potential accumulation zones where buying interest could emerge.
Is COIN in a significant dip or a Value Dip right now?
COIN has a Value Score of 47/100. It is not currently flagged as a significant dip in the Top Dips list. It is not listed as a Value Dip because the long-term sentiment or value-score threshold does not qualify.
View the full interactive analysis on StockDips.AI.