CPRT Monthly Technical Analysis
Copart Inc
Online vehicle auction platform connecting insurers, dealers, and buyers.
CPRT Technical Analysis Summary
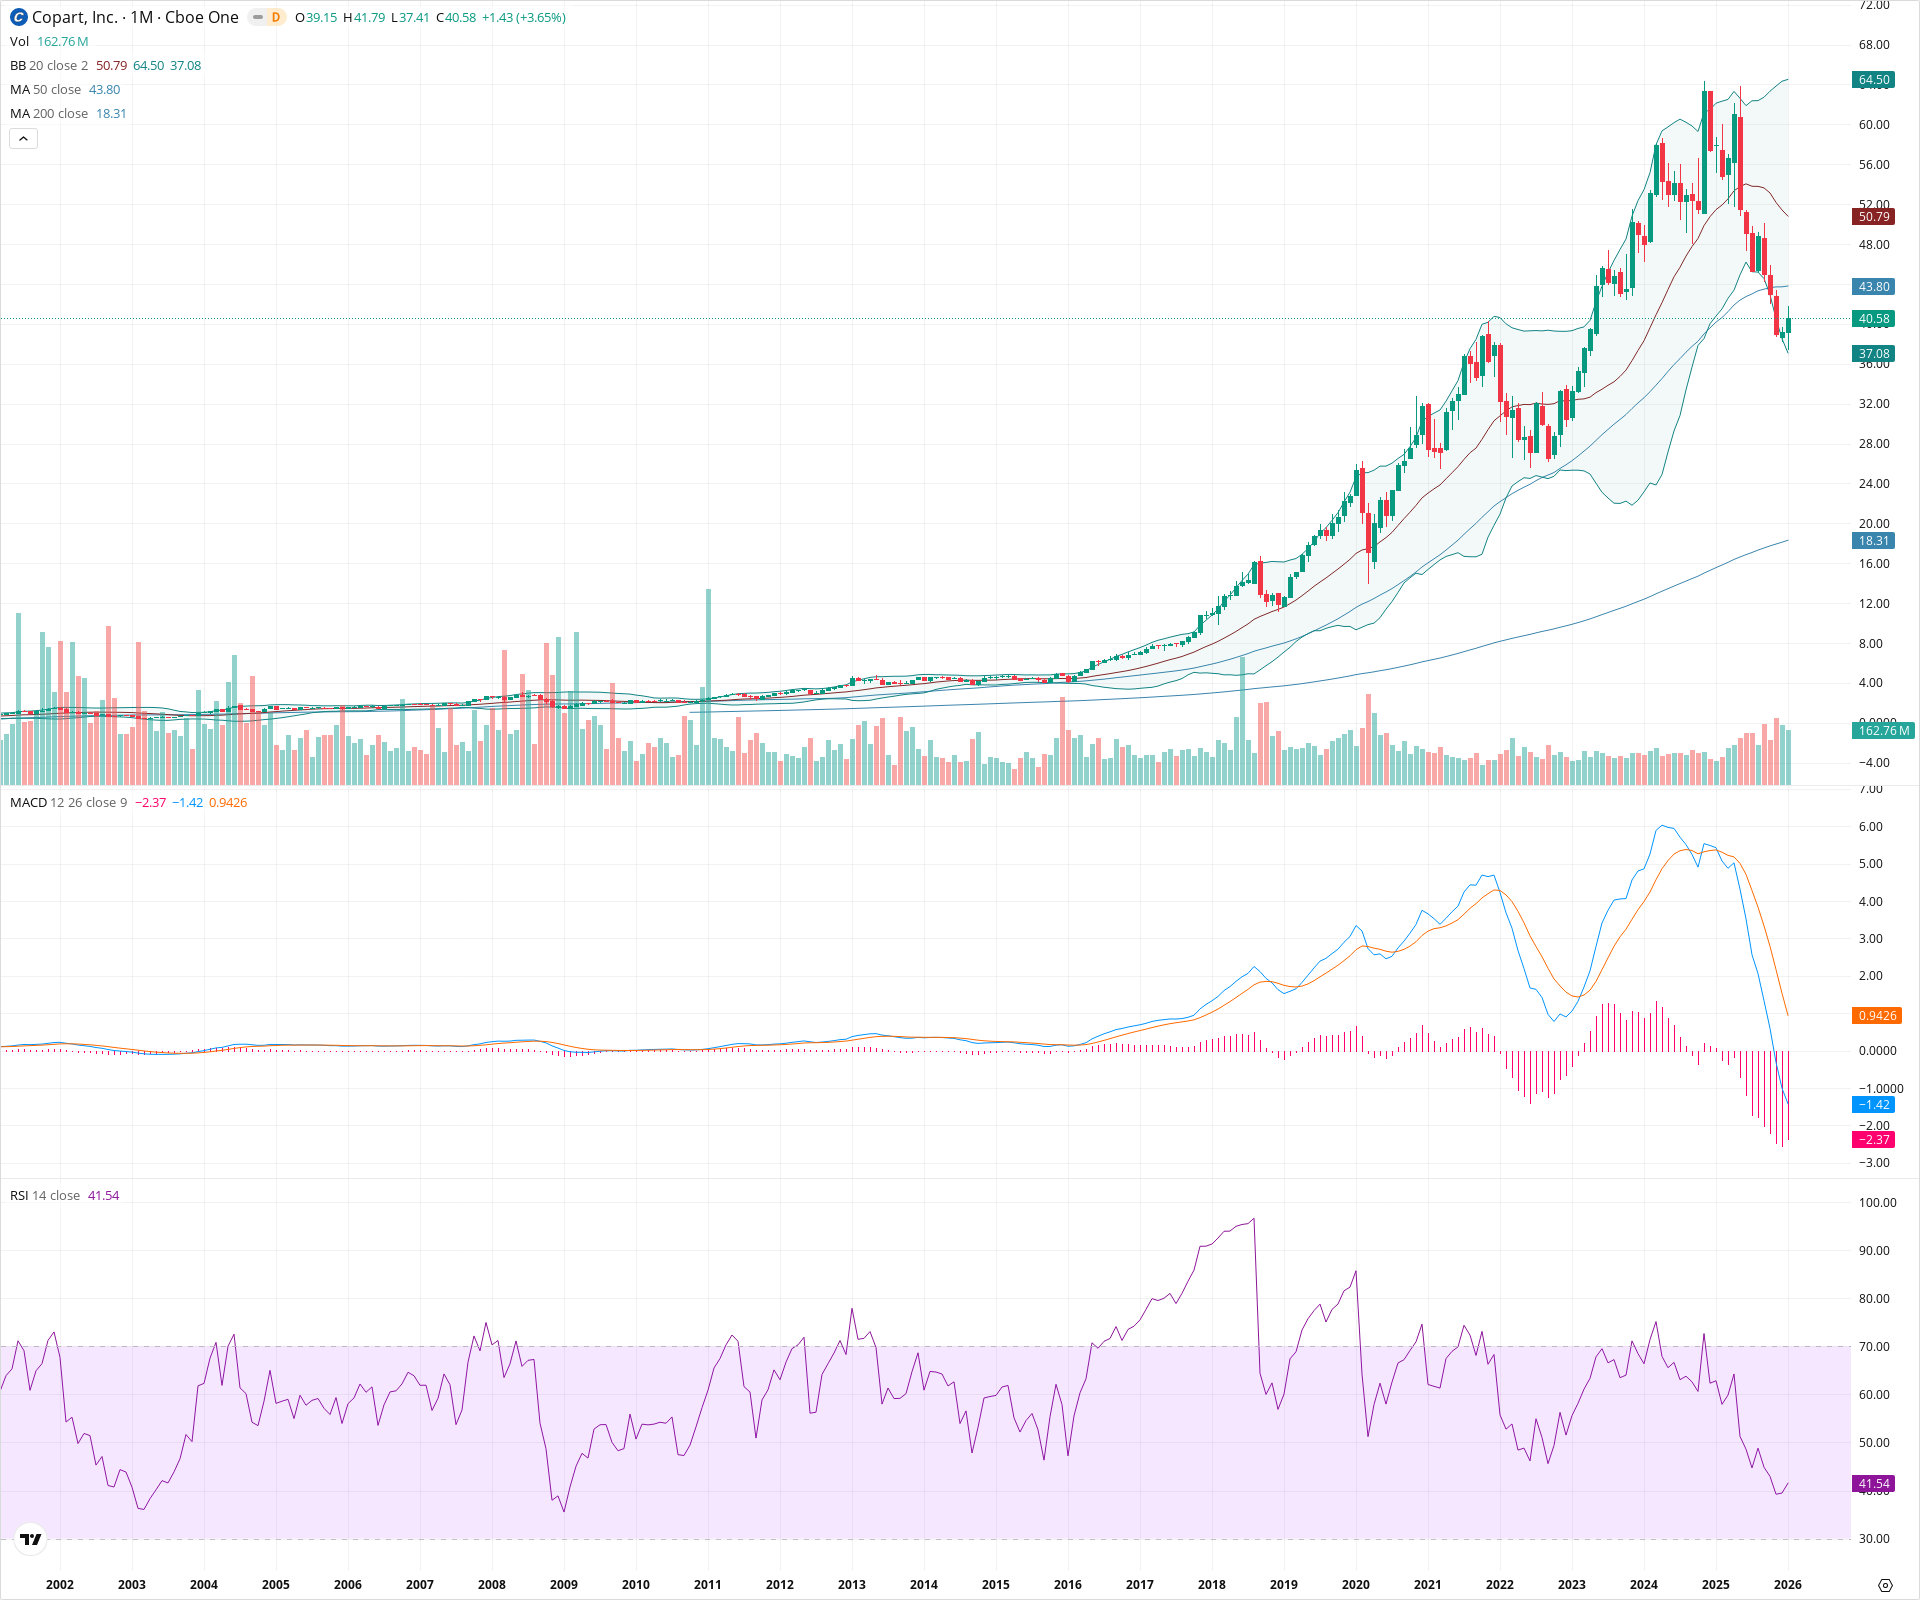
Copart is undergoing a significant monthly correction within a secular bull market, having recently lost support at the 50-month SMA. While the long-term trend remains upward defined by the 200-month SMA, short-term momentum is decisively bearish with a negative MACD crossover and RSI approaching oversold territory. The stock is currently testing critical support near the lower Bollinger Band at approximately $37, which will be pivotal in determining if the correction stabilizes or deepens toward the $30-$32 zone.
Included In Lists
Related Tickers of Interest
CPRT Monthly Chart
Sentiment
Short-term Sentiment (days to weeks): Bearish
Price is trading below the 20-month and 50-month SMAs, with the MACD showing a bearish crossover and negative histogram expansion.
Long-term Sentiment (weeks to months): Bullish
The secular trend remains intact as price sits well above the rising 200-month SMA, suggesting this is a correction within a larger uptrend.
Report Metadata
- Timeframe: monthly
- Generated at: 2026-02-02T05:30:59.010Z
- Model: gemini-3-pro-preview
Support Price Levels
| Level | Range | Strength | Notes |
|---|---|---|---|
| $36.75 | $36.00 - $37.50 | Strong | Aligns with the lower Bollinger Band and recent monthly lows. |
| $31.00 | $30.00 - $32.00 | Strong | Historical resistance turned support from the 2021-2022 consolidation phase. |
Resistance Price Levels
| Level | Range | Strength | Notes |
|---|---|---|---|
| $44.40 | $43.80 - $45.00 | Strong | The 50-month SMA acts as immediate dynamic resistance. |
| $51.40 | $50.80 - $52.00 | Weak | Confluence of the 20-month SMA (Bollinger basis) and psychological round number. |
| $57.75 | $57.00 - $58.50 | Strong | All-time high structural resistance zone. |
Potential Chart Patterns in Formation
| Strength | Pattern | Signal | Target | Details |
|---|---|---|---|---|
| Strong | Mean Reversion / Correction | Bearish | $37.08 | After a parabolic extension to all-time highs, price has corrected sharply to test the lower Bollinger Band and longer-term moving averages. |
Frequently Asked Questions about CPRT
What is the current sentiment for CPRT?
The short-term sentiment for CPRT is currently Bearish because Price is trading below the 20-month and 50-month SMAs, with the MACD showing a bearish crossover and negative histogram expansion.. The long-term trend is classified as Bullish.
What are the key support levels for CPRT?
StockDips.AI has identified key support levels for CPRT at $36.75 and $31.00. These levels may represent potential accumulation zones where buying interest could emerge.
Is CPRT in a significant dip or a Value Dip right now?
CPRT has a Value Score of 16/100. It is not currently flagged as a significant dip in the Top Dips list. It is not listed as a Value Dip because the long-term sentiment or value-score threshold does not qualify.
View the full interactive analysis on StockDips.AI.